
Figure 5.
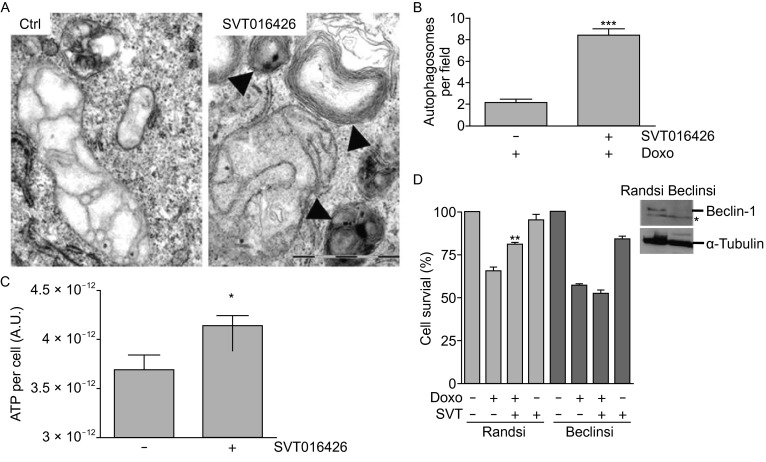
Autophagy is implicated in cell recovery upon Apaf1 inhibition. (A) Representative TEM images of HeLa cells treated with 0.25 µmol/L Doxo for 24 h and maintained for additional 24 h with 0.5 µmol/L Doxo in the presence or absence of 5 µmol/L SVT016426. Black arrows indicate the presence of autophagosomes. Scale bar equal to 1 µm. (B) Quantification of the number of autophagosomes per field was performed analyzing 40 randomly selected fields per image from two independent experiments. (C) Measurement of ATP content per cell in HeLa cells treated as described in (A) in the presence or absence of 5 µmol/L SVT016426. Statistical significance was assessed by means of two-tailed Student’s t-test (*P < 0.05; ***P < 0.001). (D) Cell survival was measured by MTT for control (Randsi) or Beclin (Beclinsi) silencing in the presence or absence of Doxo (1 µmol/L) and SVT016426 treatment (SVT; 5 µmol/L) (mean ± SD, n = 3). Asterisks represent significant differences relative to apoptotic treatment as determined by one-way ANOVA test with Bonferroni’s multiple comparison post-test (**P < 0.05). Immunoblotting for Beclin-1 and α-tubulin (loading control) was provided in cell extracts silenced using a random siRNA (Randsi) or Beclin siRNA (Beclinsi). Asterisk marks for unspecific bands recognized by the antibody