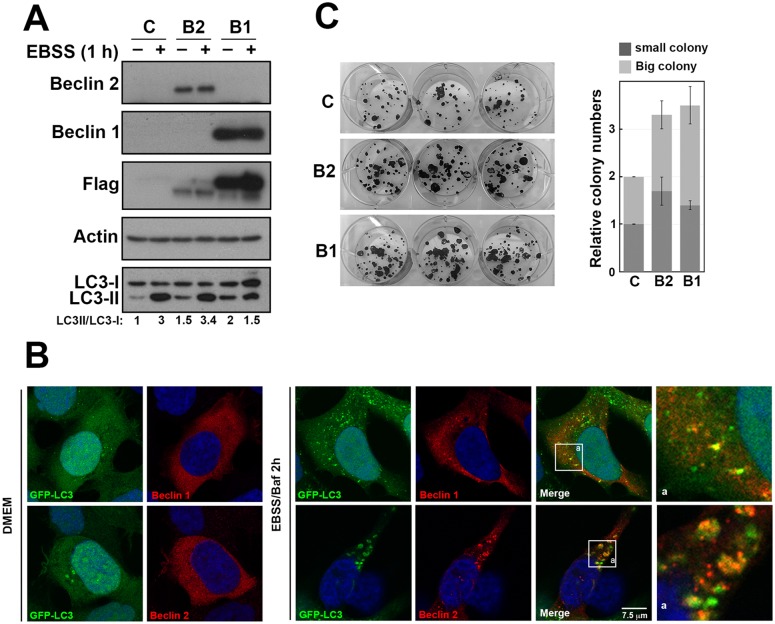
Fig 4. The effects of overexpressing Beclin 1 and Beclin 2 in autophagy and cell survival.
(A) SAS cells were transfected with control plasmid, plasmids expressing flag-tagged Beclin 1 (B1) or Beclin 2 (B2). At 24 h posttransfection, cells were treated with Earle’s balanced salt solution (EBSS) for 1 h starvation. Lysate were prepared and analyzed by immunoblot using the indicated antibodies. The intensity of LC3-I and LC3-II was measured using ImageJ and the ratio of LC3-II/LC3-I are shown below. (B) HEK293 cells stably expressing GFP-LC3 were transfected with plasmid expressing flag-tagged Beclin 1 or Beclin 2 and cultured in either normal culture medium (DMEM) or starvation condition (EBSS) as indicated. Cells were fixed at 48 h after transfection. Indirect immunofluorescence staining was performed using anti-Flag M2. 4’,6-Diamidino-2-phenylindole (DAPI) staining revealed the nucleus. The box region is enlarged (a). (C) SAS cells were transfected with control or flag-tagged Beclin 1 and Beclin 2 for 24 h. Transfected cells were replated at 200 cells per well in 6-well plate. After 14 days, colonies were visualized using 1% crystal violet in methanol. The experiments were conducted three times independently.

