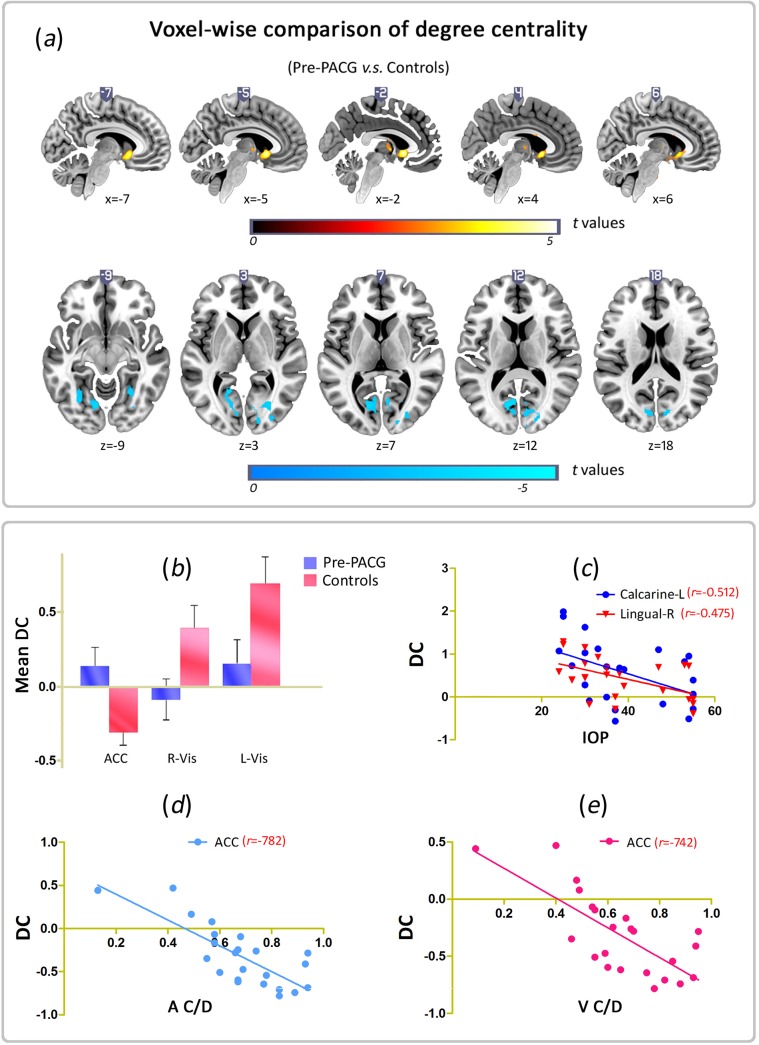
Fig 2. Voxel-wise comparison of DC between Pre-PACG and Controls & the relationships between changed DC areas and clinical variables.
(a) Brain clusters showing a significant difference in degree centrality (DC) in the Pre-PACG patients compared with the Controls (cluster-level p < 0.05, GRF correction). Hot color (cool) indicates significant increased (decreased) DC in the Pre-PACG patients. (b) Bar plot of DC for the significant clusters in Pre-PACG v.s. Controls. DC, degree centrality; ACC, anterior cingulate cortex; L(R), left (right) hemisphere; Vis, visual. (c) DC values in the right lingual gyrus (R Ling, r = -0.512, p < 0.05) and left calcarine (L Cal, r = -0.475, p < 0.05) are significantly negatively correlated with the intraocular pressure (IOP) in the Pre-PACG patients. (d) DC values in the left anterior cingulate cortex (ACC) were significantly negatively correlated with A C/D (r = -0.782, p < 0.05) in the Pre-PACG patients. (e) DC values in the left anterior cingulate cortex (ACC) were significantly negatively correlated with V C/D (r = -0.741, p < 0.05) in the Pre-PACG patients.

