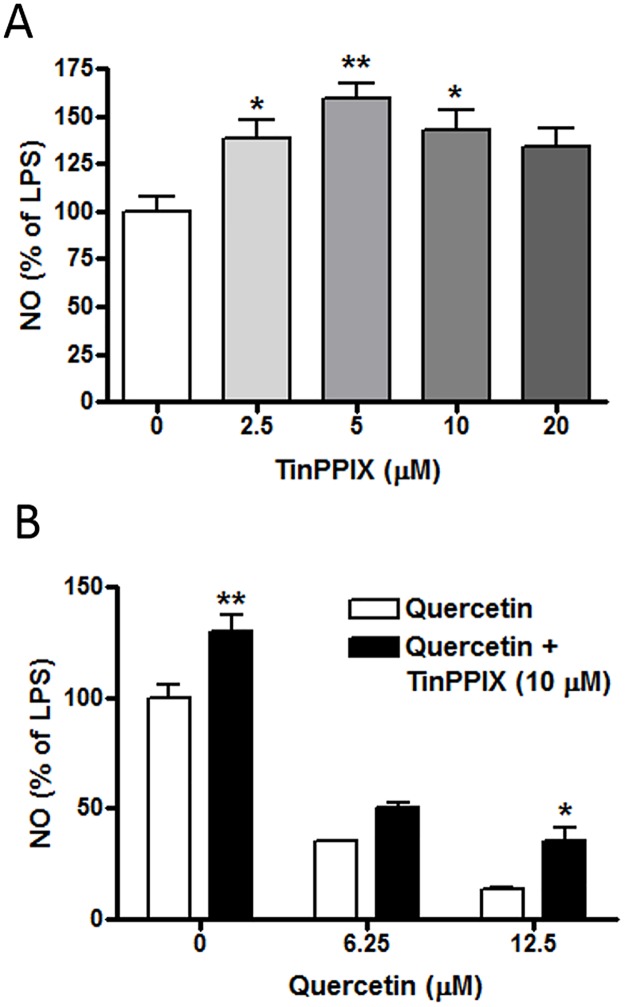
Fig 8. Effects of TinPPIX on LPS- and quercetin-induced NO production.
(A) Cells were pretreated with different doses of TinPPIX for 1 h followed by stimulation with LPS (100 ng/ml) for 16 h. Results are means ± SEM from four independent experiments and were analyzed by one-way ANOVA followed by Bonferroni post-tests. *p<0.05, **p<0.01 vs. LPS alone. (B) Cells were treated with different doses of quercetin in the presence and absence of TinPPIX (10 μM) for 1 h followed by stimulation with LPS (100 ng/ml) for 16 h. Results are means ± SEM from three independent experiments and were analyzed by two-way ANOVA with Bonferroni post-tests. *p<0.05, **p<0.01 vs. no TinPPIX.

