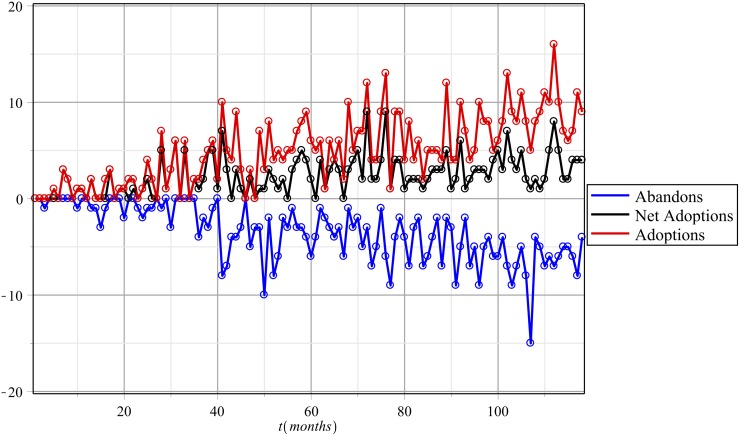
Fig 2. Fluctuations per month.
The red line indicates the number of people who transitioned from susceptible to infected (0 → 1); the blue line reveals the number who transitioned from infected to susceptible (1 → 0); and black shows the net change in the total number of adoptions for the given month.

