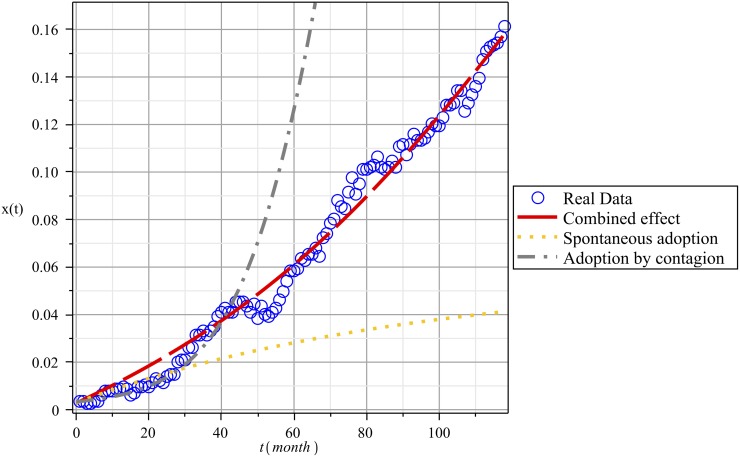
Fig 6. Fitting the Theoretical Solutions Provided by Model 2 and Adoption Data over Time.
The gray curve represents the fit for the pure contagion case: ϑ = 0, β = 0.0045, γ = 0.01, with a residual mean square SD = 0.2. The orange curve is the fit for pure non-social influences: ϑ = 0.0006, β = 0, γ = 0.01, SD = 0.054622. The red curve is the fit for the combined effect ϑ = 0.0007, β = 0.0017, γ = 0.01, SD = 0.005.

