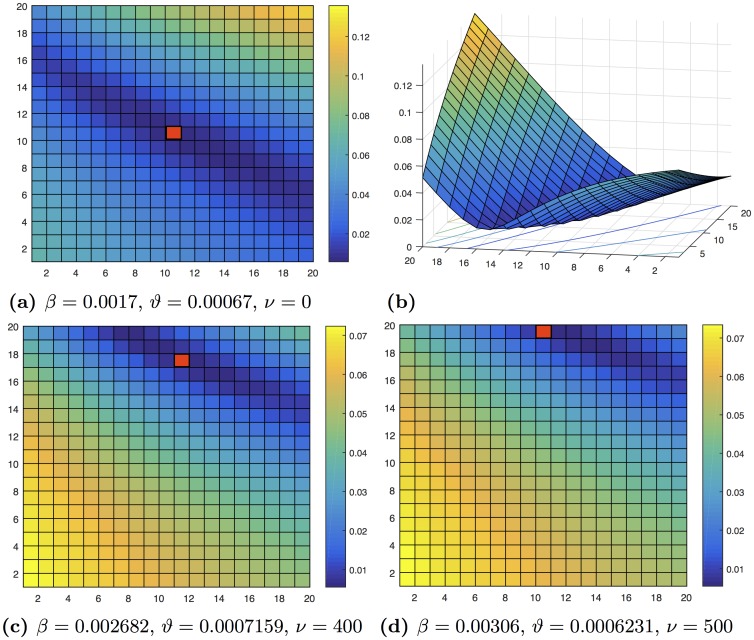
Fig 8. The figure shows an example of 20 × 20 mesh for fitting the model parameters.
In (a), (c) and (d) the vertical axis indicates the interval partition for the values of parameter β and the horizontal axis indicates the partition for the parameter ϑ. A mesh is constructed for each value of the rewiring rate ν. The (ϑ, β) pair, which fulfills Eq (18), is represented by a red box in each figure. (a) depicts the case of a static network with ν = 0, and (b) is a three-dimensional representation of the fitting, where the vertical axis indicates the value found for the “distance” between the model solution and the real curve. Finally, (c) and (d) represent the cases of networks with rewiring.

