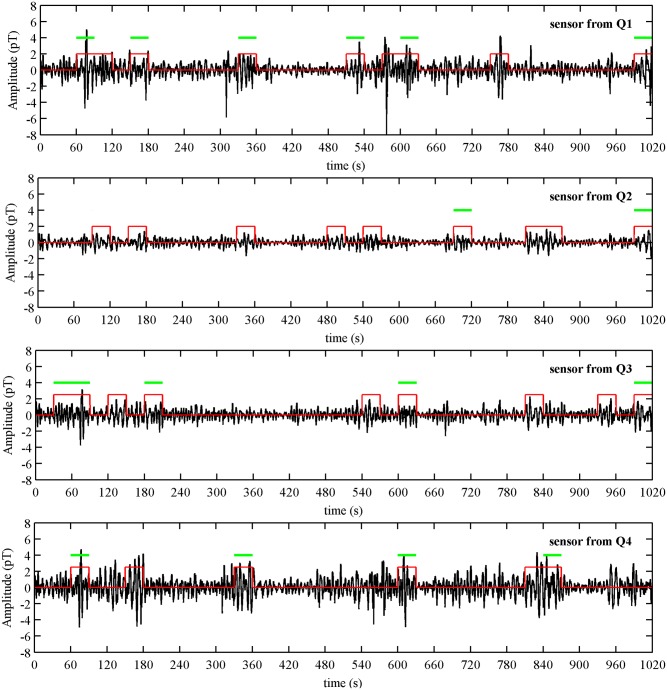
Fig 2. An example of uterine MMG burst activity estimates detected from one sensor in each quadrant for Subject 202.
A marker is plotted over burst activity of the MMG signal. The horizontal bars on top indicate the burst activity that fitted the connectivity criteria for the representative sensor shown.

