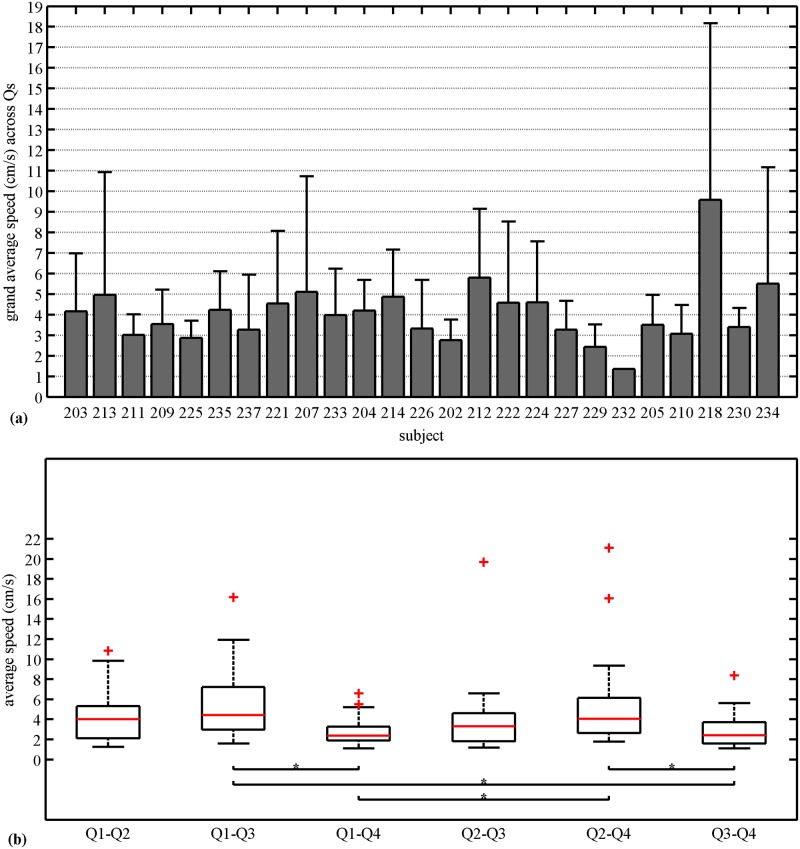
Fig 4. Propagation speed.
(a) Grand average speed along with standard deviation across quadrants for each subject. (b) Average speed for each pairwise combinations of quadrants across subjects. The solid horizontal line inside the box corresponds to median, the edges of the box are the 25th and 75th percentiles, the whiskers extensions are the most extreme data points, and “+” markers correspond to the outliers. Kruskal-Wallis analysis and Tukey’s least significant difference correction with 99% CI was applied.

