
Fig 6. An illustration of the interface residue types onto the surface shown from the growth hormone-receptor complex structure (PDB ID: 1A22).
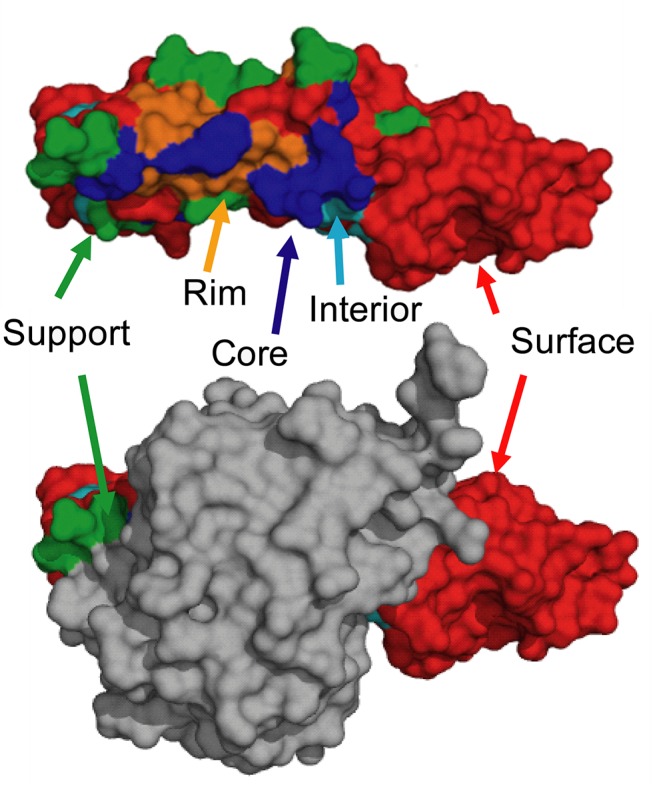
The monomer structure of one of the chains is shown on top with the complex structure on bottom. ‘Core’ residues (blue) are exposed in the monomeric structure but buried in the complex; ‘Support’ residues (green) are partly buried in the monomeric structure and fully buried in the complex; ‘Rim’ residues (orange) are fully exposed in the monomeric structure and partly buried in the complex; ‘Interior’ residues (sky blue) are fully buried in the monomer, while surface residues (red) are fully exposed in both the monomeric and complex structures.