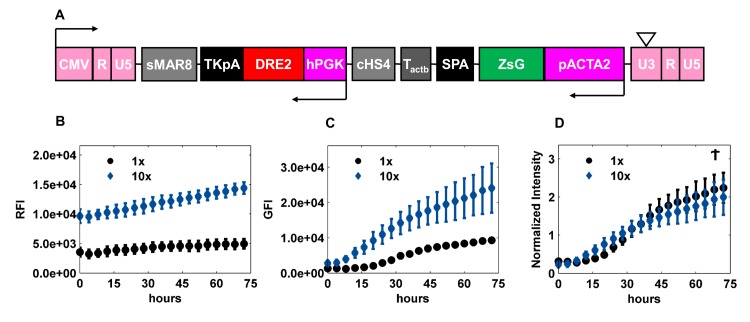
Fig 1. Normalized Promoter Activity is independent of gene copies per cell.
(A) Schematic of LVDP-pACTA2-ZsGreen. CMV–promoter sequence from cytomegalovirus; sMAR8 –synthetic MAR sequence 8; TKpA–thymidine kinase polyA from herpes simplex virus; DRE2 –DsRed Express 2; hPGK–human phosphoglycerate kinase promoter; cHS4 –chicken hypersensitive site 4; Tactb−a G-rich sequence from the extension of β-actin gene; SPA–synthetic poly A; ZsG–ZsGreen; pACTA2 –α smooth muscle actin promoter; 5’ LTR: CMV + R + U5; 3’LTR: U3 + R +U5 (B-D) hBM-MSCs were transduced with LVDP-pACTA2-ZsGreen at two different concentrations that differed by 10-fold (1X and 10X). Both red and green fluorescence intensity were measured upon induction to myogenic differentiation. (B) Red Fluorescence Intensity (RFI), (C) Green Fluorescence Intensity (GFI), and (D) Normalized Intensity were plotted against time. Normalized intensity was obtained by dividing GFI by a weighted average of RFI over time, where the weights were determined from a beta distribution (see Materials and Methods) such that the median absolute standard deviation was minimized from the LOESS fit. Data shown are representative of at least three experiments performed with similar results. Ϯ p-value > 0.05.

