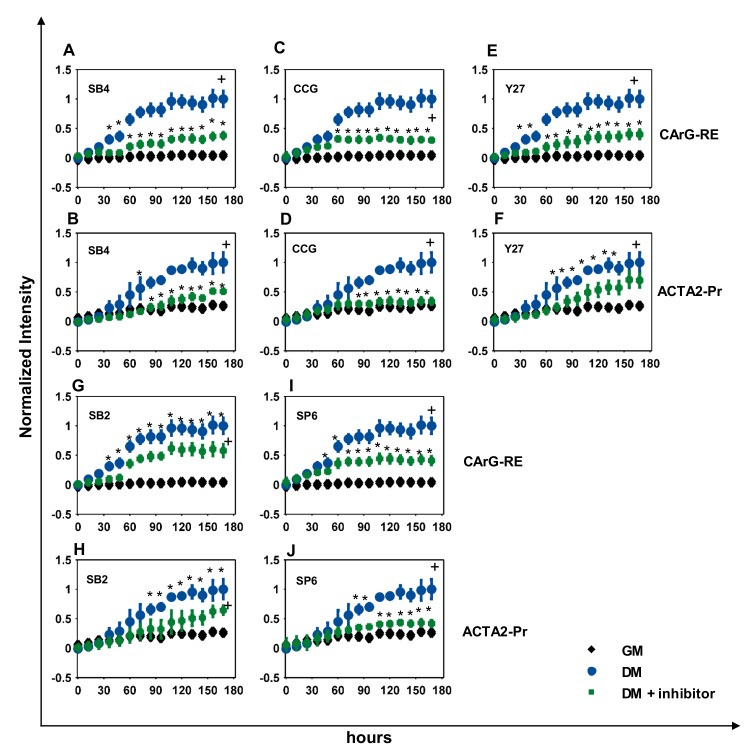
Fig 6. Effects of signaling pathways on Pr/RE activity.
Dynamics of Pr/RE activity in hHF-MSCs cultured in DM containing chemical inhibitors. (A, B) 10 μM SB431542 (SB4); (C, D) 10 μM CCG1423 (CCG); (E, F) 10 μM Y27632 (Y27); (G, H) 20 μM SB203580 (SB2); (I, J) 10 μM SP600125 (SP6). MSCs cultured in GM served as negative control and MSCs cultured in DM served as positive control. Normalized activities of (A, C, E, G, I) CArG-RE, and (B, D, F, H, J) ACTA2-Pr are shown. The normalized values were scaled from 0–1 and plotted as a function of time. * indicates p < 0.05 between DM and GM as determined by Student’s two-tailed t-test at individual time points. + indicates statistical significance of the Pr/RE activities under DM vs GM evaluated over the entire curve by growth curve analysis (p < 0.05).

