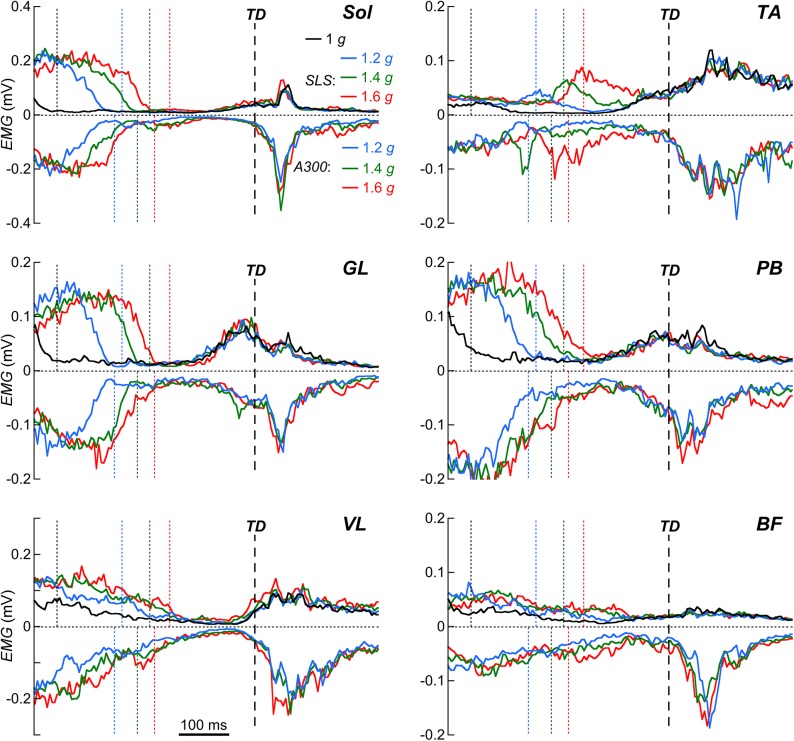
Fig 4. Effect of the experimental conditions on the EMG–pattern.
EMG-patterns of soleus (Sol), tibialis anterior (TA), gastrocnemius lateralis (GL), peroneus brevis (PB), vastus lateralis (VL) and biceps femoris (BF) muscles are presented from 450 ms before TD to 250 ms after TD. Positive traces are for the 1 g and the SLS-conditions and negative traces for the A300-condition. Black line is for 1 g; blue lines are for 1.2 g, green for 1.4 g and red for 1.6 g. Traces are the grand mean of the eight subjects averaged over periods of 5 ms and are synchronized to TD (vertical interrupted line). Dotted vertical colored lines correspond to the TO (same color than the curves) in each condition.

