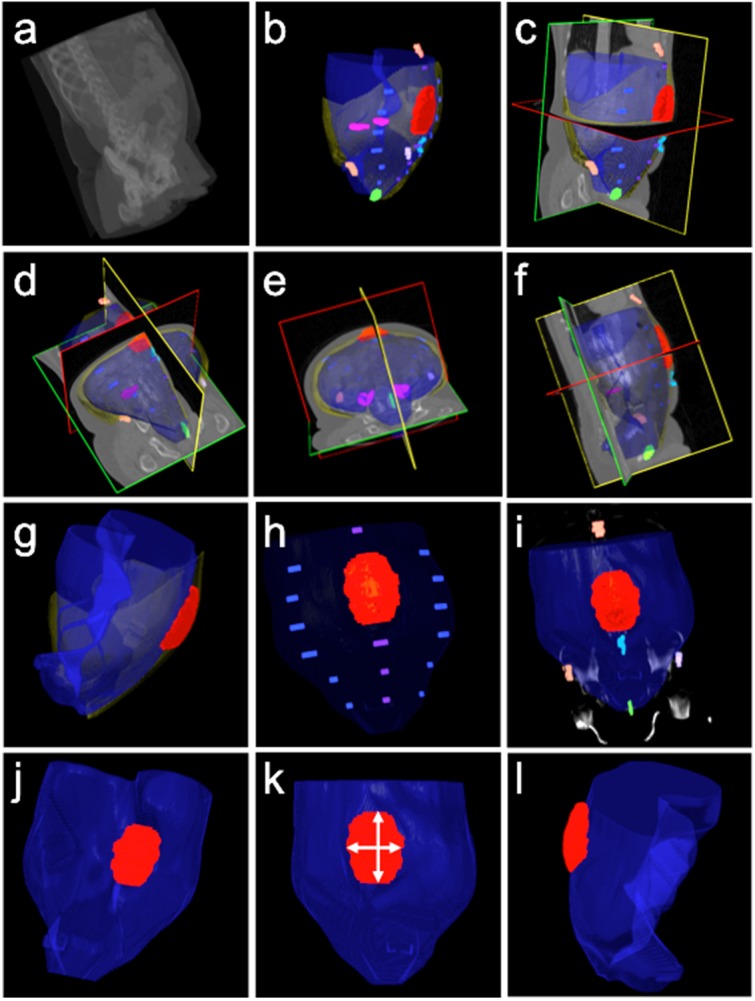
Fig 7. Illustration of VH characteristics in terms of processed label results.

The first row, from (a) to (c), demonstrates a matchup between the original image data and the processed labels, where the abdominal walls were interpolated. The second row, from (d) to (f), demonstrates the coherence of interpolated abdominal walls with the original image in three different views. The third row, from (g) to (i), illustrates a combined model of abdominal wall and hernia volume for shape-related VH characteristics, the relative location of VH with respect to the linea alba and linea semilunaris, and the relative location of VH with respect to skeletal landmarks and the umbilicus. The fourth row, from (j) to (l), demonstrates feasibility of measuring the VH defect size, width and length of VH, and ratio of volume size between the hernia sac and the abdominal cavity.
