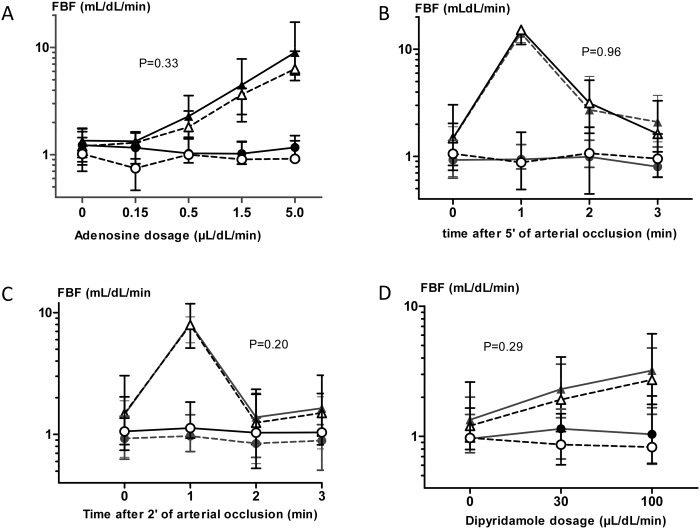
Fig 3. Forearm blood flow measurements.
FBF values in the experimental forearm (triangle) and non-experimental forearm (circle) after ticagrelor treatment (black symbols) or placebo treatment (open symbols, dashed line) during intrabrachial administration of adenosine (A), after five (B) and two (C) minutes of forearm ischemia, and during intrabrachial administration of dipyridamole (D). P-values represent the effect of ticagrelor on the FBF-values.

