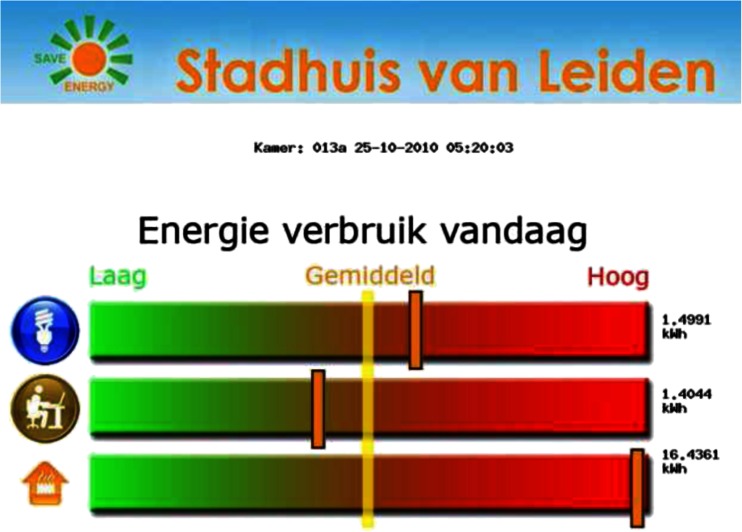
Fig. 1.
Feedback presentation in the Feedback only condition. The logos represent energy use in 3 different categories: lights, computers, and thermostat. The uninterrupted (yellow) line in the middle of the three horizontal bars indicates average use over 3 weeks, and the short (orange) lines in each bar show the use per room on a specific time and day

