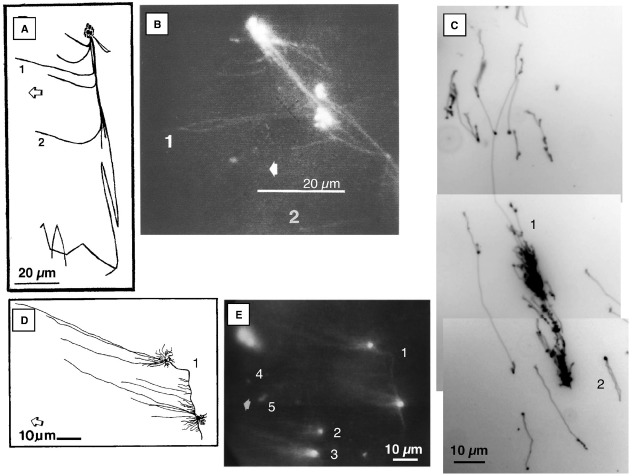
FIGURE 1.
Fluorescence microscopic images of ethidium-stained mtDNA and ptDNA molecules. (A) and (B) Images of DNA-protein structure from osmotically lysed tobacco BY-2 mitochondria. Complex branching DNA-protein structure with three bright nodes, long immobile fiber, and several fibers that extend leftward toward the anode (examples: 1 and 2) and rightward when the polarity of the electric field was reversed. (Adapted from Oldenburg and Bendich, 1998b). (C) Maize ptDNA molecules from the well-bound fraction following PFGE. Examples: (1) multigenomic complex structure with a Y-branch and (2) a genome-sized circular molecule. Approximately 84% of the DNA mass was in the large complex form, 11% in small branched molecules, and 4% in circular molecules. The in-gel ptDNA was prepared from 14-day maize seedlings. (Adapted from Oldenburg and Bendich, 2004a) (D) and (E) Images of liverwort mtDNA molecules from the well-bound fraction following PFGE. One large complex structure with two bright nodes of fluorescence that are connected by a bright fiber and several fibers extend from each node toward the anode (1). Two smaller “comet” structures with several “tail” fibers extending from the bright ”head” (2, 3). A few small molecules were moving toward the anode (examples: 4, 5). (Adapted from Oldenburg and Bendich, 1998a) The molecules in (B) and (E) were recorded using an epifluorescence microscope equipped with a CCD camera, video monitor, and recorder. Photographs were then taken of ethidium-stained DNA on the monitor and the respective drawings, (A) and (D), were made by tracing the DNA on the monitor. The molecules in (C) were recorded using an epifluorescence microscope equipped with a digital camera and computer. Broad arrows point toward the anode in (A), (B), (D), and (E).

