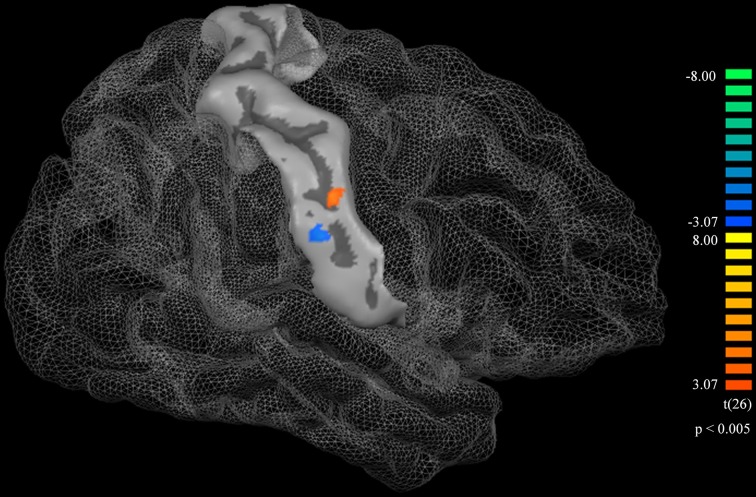
Figure 1.
A surface atlas showing of the postcentral gyrus and a cortical thickness difference map. The orange represents the area in which the music playing group had greater cortical thickness than the non-music playing group. The blue represents the area in which the music playing group had less cortical thickness than the non-music playing group. Both thicker and thinner areas were statistically significant (p < 0.005, corrected).

