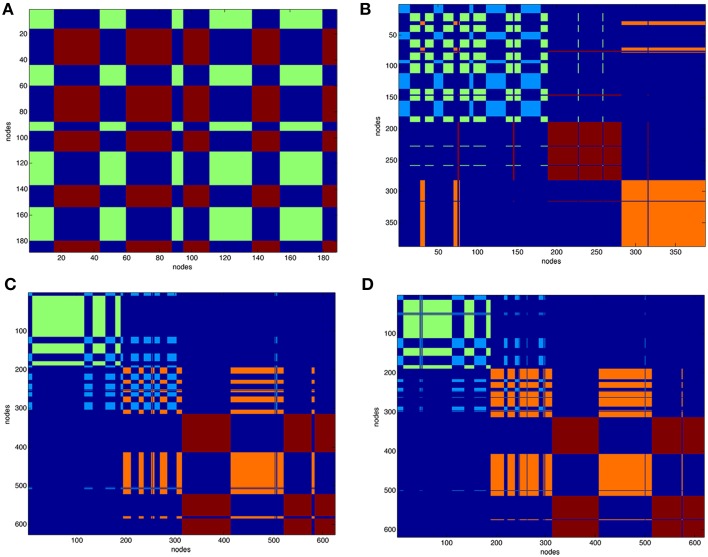
Figure 3.
Clustering of protein contact networks. Distribution of clusters along sequence in a matricial space. Partition color maps of (A). VEGFA (200 nodes), (B). VEGFR1d2_R2d3/VEGFA, (C). Fab-bevacizumab/VEGFA, (D). ranibizumab/VEGFA. The first 200 nodes in complexes corresponds to bound VEGFA. In (A) green and light blue clusters corresponds to VEGFA. In (B–D) dark red and orange are clusters of anti-VEGF. Residues (nodes) belonging to the same cluster have the same color, long projections “whiskers” in the map represent residues shifting to a different cluster with respect to that of neighbors in sequence. The background is dark blue and characterizes residues that are not in the same cluster.

