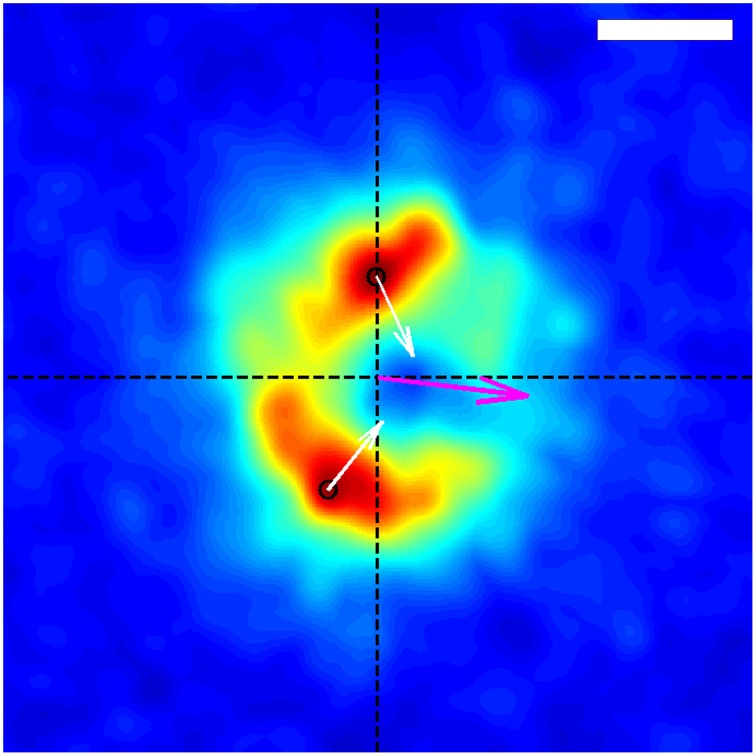
Figure 4.
Average spatial distribution of traction forces exerted by the growth-cone shown in Figure 1 over the time span of the entire data capture, in the frame of reference of the growth-cone. The growth-cone is moving to the left along the horizontal axis shown. The purple arrow situated at the origin indicates the direction of the net force. The black circles indicate the locations of the stress peaks in the positive and negative y-planes, and the white arrows depict the corresponding direction and relative magnitude of those stresses. The scale bar represents 5 μm.

