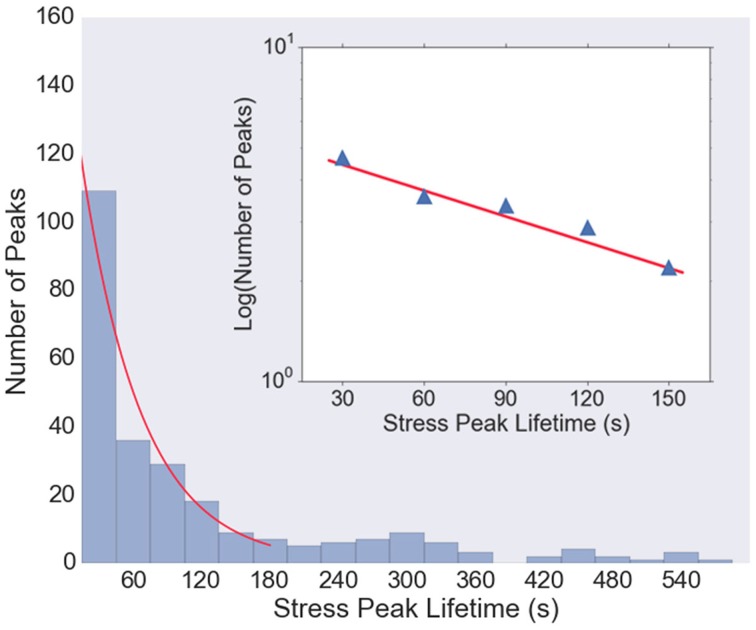
Figure 5.
Histogram of lifetimes of stress peaks. Most stress peaks are of short duration, with some longer, and peak lifetimes of about 30–150 s are well-fit with an exponential distribution (red curve). Very short (< 15 s) and very long (>600 s) lived stress peaks are not shown in the histogram. Inset: Log-linear plot of histogram values from t = 30 to t = 150 s, with a least-squares fit (red line) with slope 1/38 s, indicating that the majority of the stress peak lifetimes follow a Poisson distribution with a decay time of about 38 s.

