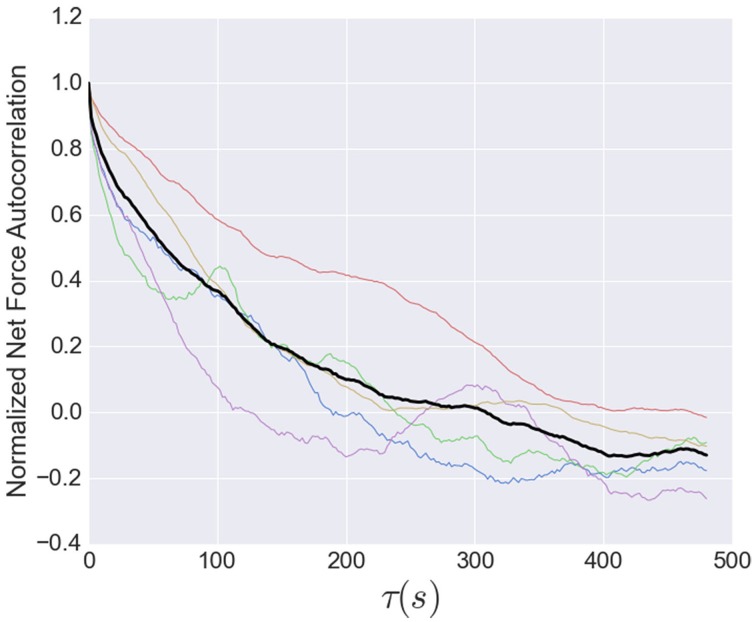
Figure 7.
Normalized net force autocorrelation. The fluctuations in the tension (net force) are shown for each dataset (colored lines) up to lag times of 500 s. The black line represents the ensemble average. Fluctuations from one image to the next are small, however, the correlations decay relatively quickly, with an initial rapid drop followed by a roughly exponential decay from 10 to 80 s with a decay time of 95 s, indicating that tension fluctuations at larger times are mostly uncorrelated. This decay time is a little more than twice that of decay time for the exponential region of the stress peak lifetime distribution (Figure 5).

