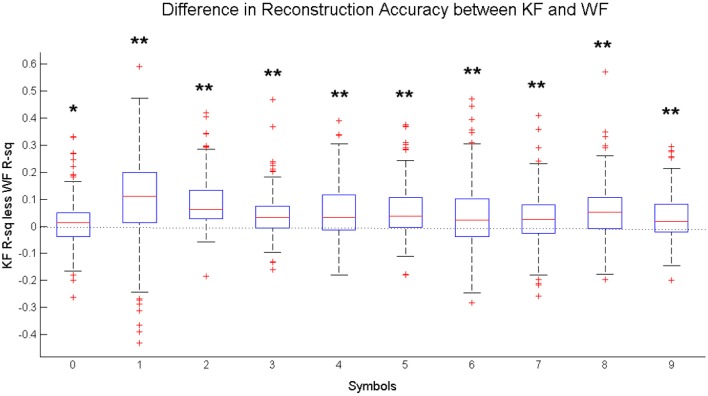
Figure 8.
Distribution of the difference between the Kalman Filter Accuracy (KF R2) and the Wiener Filter Accuracy (WF R2) between subjects, measured for each written character independently. Statistical Difference between the KF and the WF performance is measured by one-sided Wilcoxon matched-pair test for each character: *significantly greater than zero at 5% significance level, **significantly greater than zero at 1% significance level.

