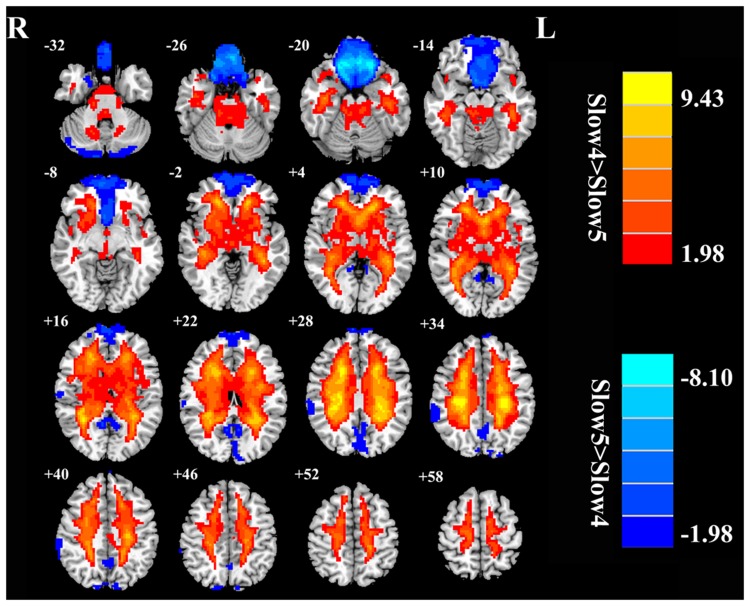
FIGURE 2.
The main effects of frequency band on ALFF. Red/hot colors identify brain regions where slow-4 ALFF values were significantly greater than slow-5 ALFF values (t-values 1.98 to 9.43; red to yellow, respectively). Blue/cold colors identify brain regions where the slow-5 ALFF values were significantly greater than the slow-4 ALFF band values (t-values –1.98 to –8.10; dark blue to light blue, respectively). Results were obtained by a two-way repeated-measure ANOVA. AlphaSim corrected p < 0.05 (individual voxel threshold p < 0.05 with a minimum cluster size of 3591 mm3).

