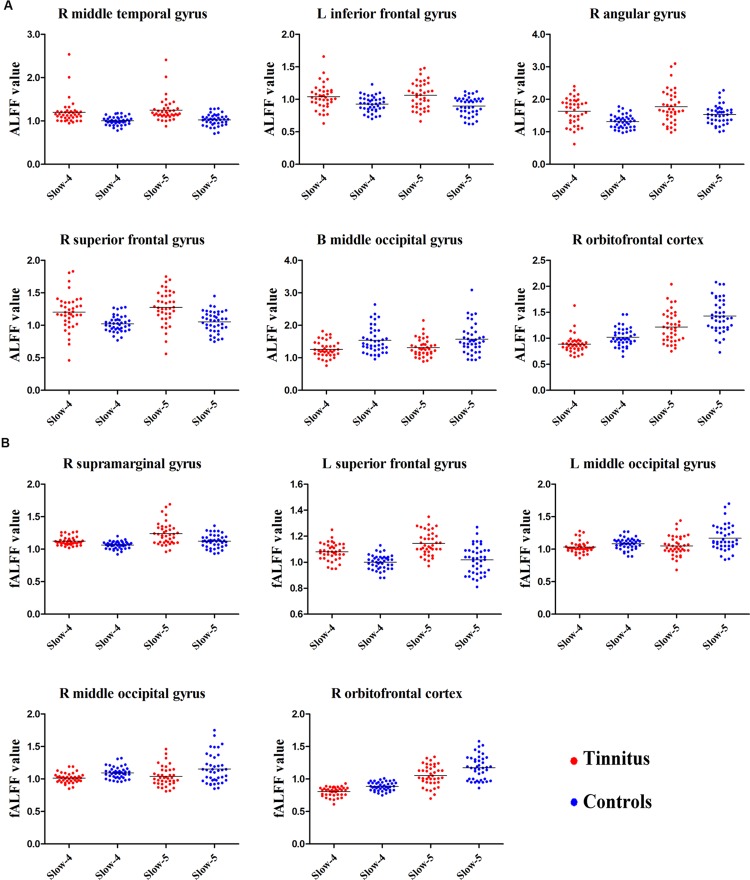
FIGURE 4.
The scatter plot showed the significant brain regions of abnormal (A) ALFF or (B) fALFF between tinnitus patients and healthy controls in slow-4 and slow-5 frequency bands. The red dots represented tinnitus patients; the blue dots represented healthy controls. L, left; R, right; B, bilateral.

