Figure 4.

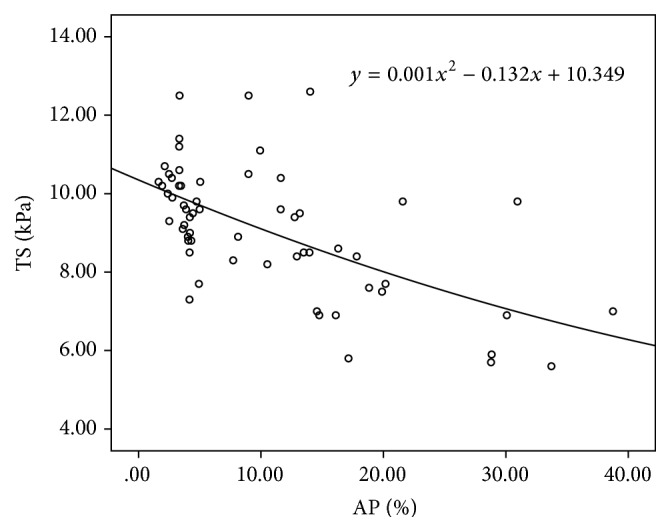
The result of TS plotted against the AP measurements of each rat. The relation between the two results has been fitted with quadric curve.

The result of TS plotted against the AP measurements of each rat. The relation between the two results has been fitted with quadric curve.