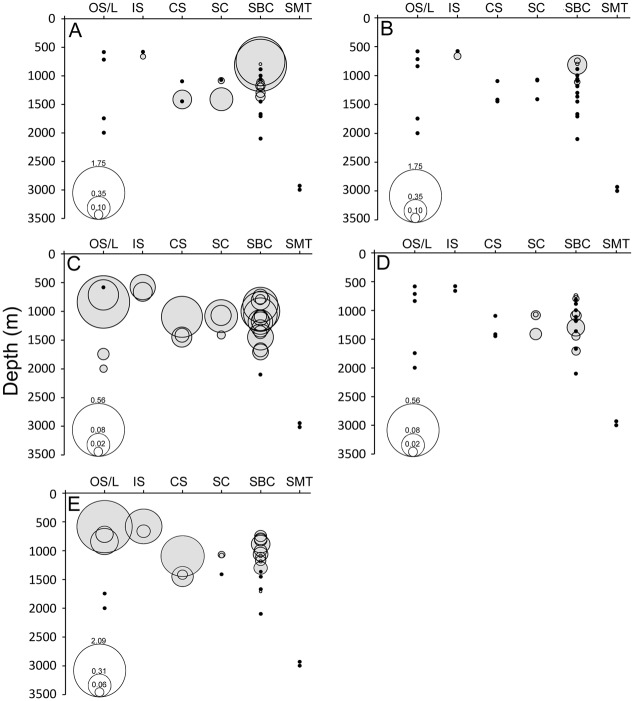
Fig 8. Abundance estimates of dominant species in the region.
(A) Paragorgia spp. (B) Primnoa? resedaeformis. (C) Synaphobranchus spp. (D) Neocyttus helgae. (E) Chaceon quinquedens. Circle size corresponds to number observed 10 m-2 as shown in key inset at lower left of each graph. Black symbols denote dives in which no species were observed. OS/L = Open Slope/Landslide Scar, IS = Inter-canyon Slope, CS = Cold Seep, SC = Slope Canyon, SBC = Shelf-breaching Canyon, SMT = Seamount.

