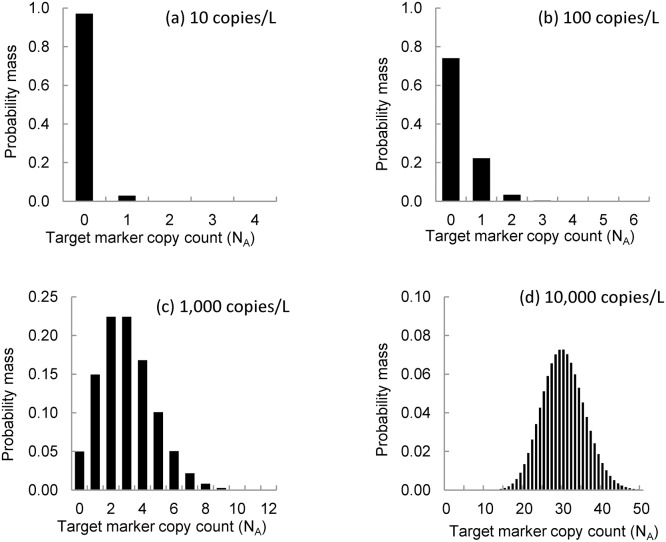
Fig 4. Simulated frequency of target marker counts in 1 μl aliquots.
The figure shows uncertainty in the number of target markers in aliquots drawn from a 100 μl extraction elution created by processing a 2 L water sample collected from a water body with an environmental concentration equal to (a) 10 copies/L, (b) 100 copies/L, (c) 1,000 copies/L, and (d) 10,000 copies/L.

