Figure 1.

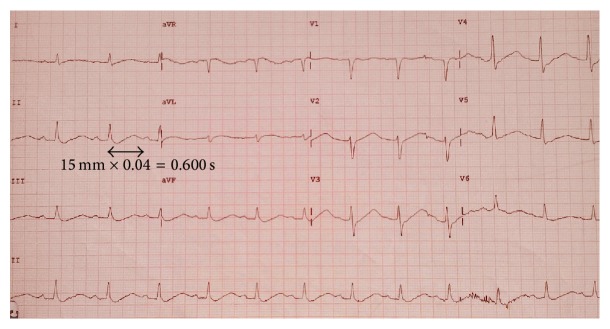
Electrocardiogram on admission shows sinus rhythm, mild increase in P waves, and mild depression of the ST segment. Note the prolonged QT interval of 600 milliseconds.

Electrocardiogram on admission shows sinus rhythm, mild increase in P waves, and mild depression of the ST segment. Note the prolonged QT interval of 600 milliseconds.