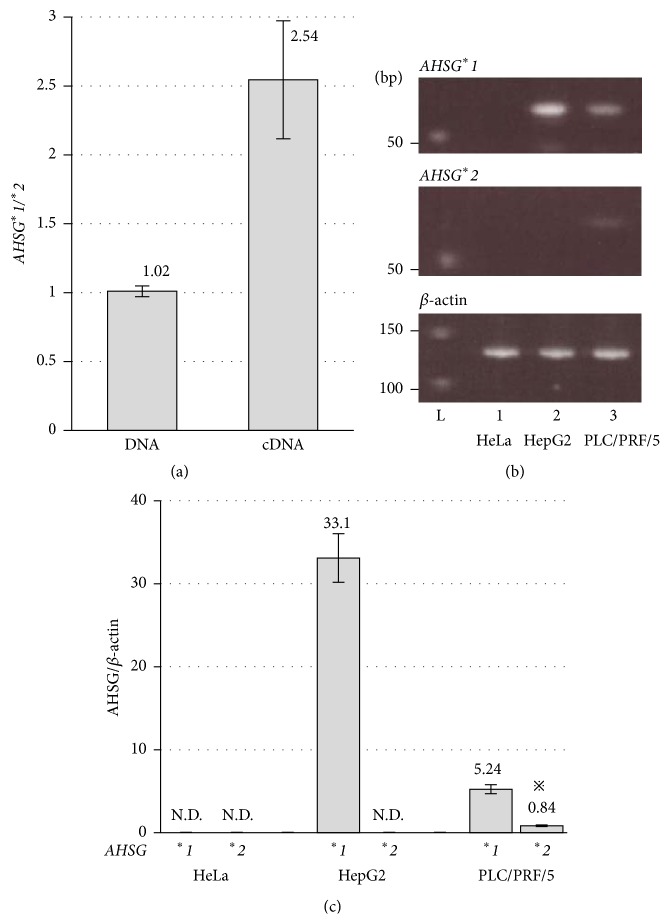
Figure 3.
Two intra-assays of intraindividual assay in the human liver tissues (a) and intracellular assay in three culture cell lines (b and c). (a) Relative amount of AHSG ∗ 1 mRNA to that of AHSG ∗ 2 was obtained in genomic DNA (left) and mRNA from the liver tissue (right). Bars represent the mean ± SD of four specimens. (b) Nondenaturing polyacrylamide gel electrophoresis of allele-specific RT-PCR for ∗ 1, ∗ 2, and β-actin products. Lane 1: HeLa; lane 2: HepG2; and lane 3: PLC/PRF/5. (c) Comparison of allelic mRNA amount of AHSG ∗ 1 and AHSG ∗ 2 to β-actin. N.D. denotes not detected. Bars represent the mean ± SD in triplicate; ※ P < 0.01 significant versus the amount of AHSG ∗ 1.

