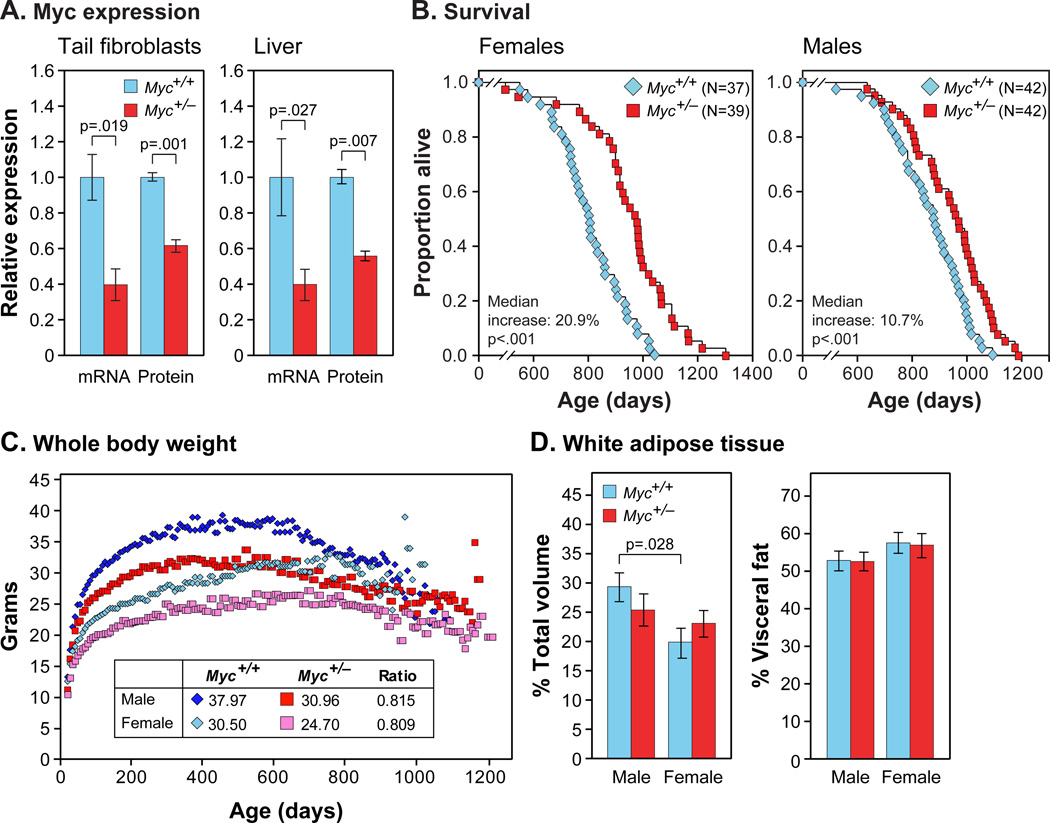
Figure 1. MYC Expression, Longevity, Body Mass and Composition.
(A) MYC mRNA and protein expression. mRNA was measured by qRT-PCR. Protein was measured by immunoblotting of tail fibroblasts or by IF of liver sections. Fibroblasts: N=3, 3 months, females. Liver: N=3–5, 5–9 months, both sexes.
(B) Survival of Myc+/+ (blue) and Myc+/− (red) mice. Each data point shows one animal (N, number of animals in each cohort).
(C) Lifelong trends of whole body weights. Median weights (3-week sliding window) of the aging cohorts in (B). Inset: weights at 500 days and relative weights of Myc+/− animals.
(D) Relative adiposity. Animals were scanned by micro-CT imaging. Left: volume of all white fat as percent of total volume of the animal. Right: volume of visceral fat as percent of total fat. N=6, 5 months.

