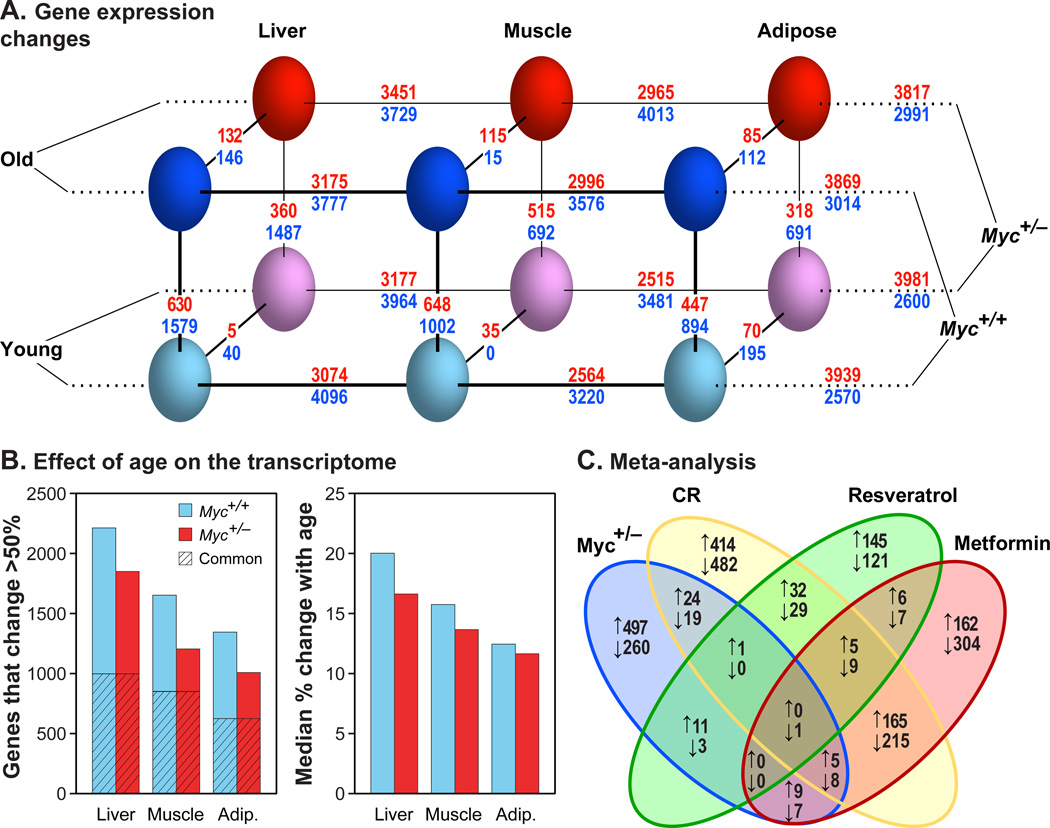
Figure 3. Transcriptome Analysis.
(A) Gene expression changes. Three parameters were compared: genotype (Myc+/+, Myc+/−), age (5, 24 months) and tissue (liver, muscle, adipose). Genotype, age, and tissue comparisons are connected with diagonal, vertical and horizontal lines, respectively. The number of genes changing expression is shown above and below each line. Red numbers: genes upregulated in Myc+/+ versus Myc+/− animals (MYC activated genes); blue numbers: genes upregulated in Myc+/− versus Myc+/+ animals (MYC repressed genes). A 1.5-fold cutoff and a FDR threshold of <5% were used. N=5–8 male animals.
(B) Effect of age on the transcriptome. Left panel: number of genes whose expression changes with age by more than 50% in either direction; hatched area represents genes in common between the two genotypes. Right panel: the median change in expression with age (expressed as %) across all expressed genes.
(C) Meta-analysis. Differentially expressed genes in Myc+/− versus Myc+/+ animals were compared with genes similarly recovered in studies of calorie restriction, metformin, or resveratrol treatment (Martin-Montalvo et al., 2013; Pearson et al., 2008). Upward arrows indicate genes upregulated in the long-lived condition (and conversely for downward arrows). Expression in liver of old male mice was compared. Skeletal muscle showed the same trends.

