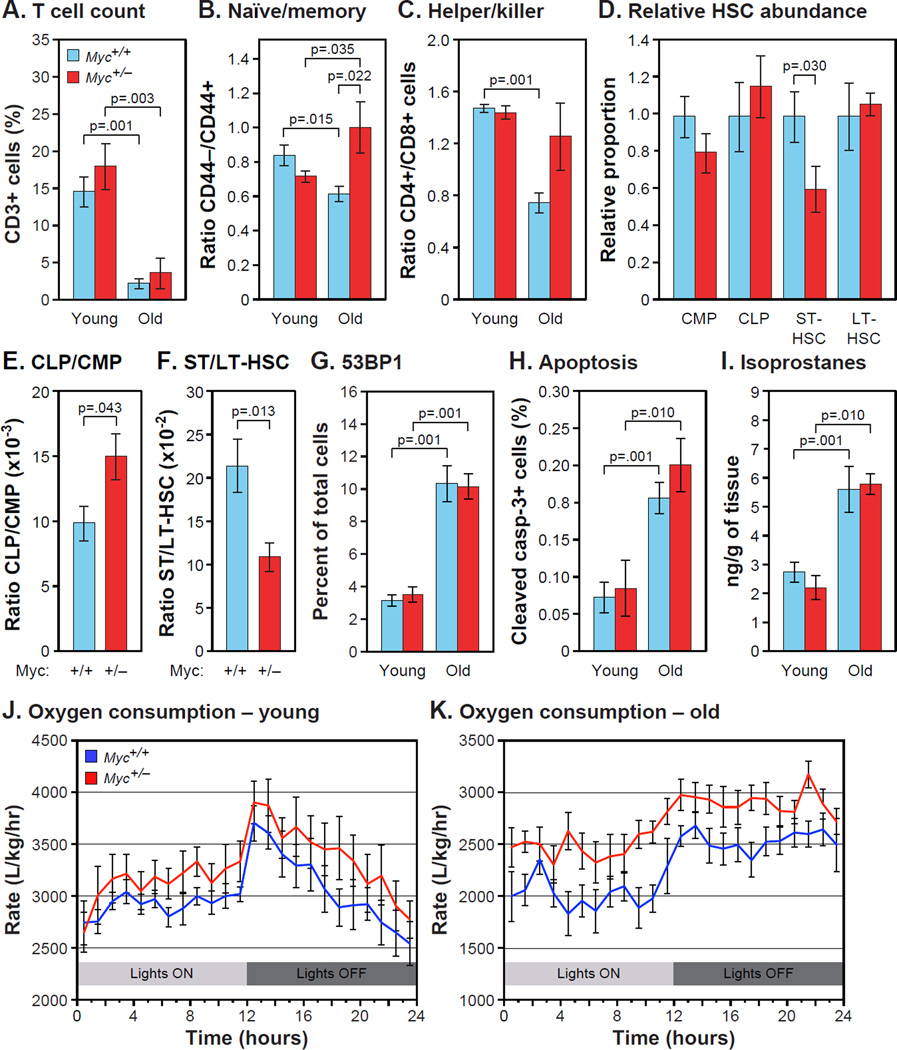
Figure 5. Immunosenescence, Stress Defenses and Metabolic Activity.
(A) Total T cells (CD3+) were analyzed by flow cytometry as % of total peripheral lymphocytes. N=8–12, 5 and 24 months, males.
(B) Ratio of naive to memory T cells (CD44−/CD44+), and (C) ratio of helper to killer T cells (CD4+/CD8+) were measured in the same samples.
(D) Proportions of common myeloid and lymphoid progenitors (CMP, CLP), and short-term and long-term hematopoietic stem cells (ST-HSC, LT-HSC) were scored as % of Lin− cells in bone marrow (tibia and femur). N=6, 16 months, females. Normalized to Myc+/+ for each comparison.
(E) Ratio of CLP to CMP, and (F) ratio of ST-HSC to LT-HSC in the same samples.
(G) 53BP1-positive cells were visualized by IF in liver sections. N=5–6, 5 and 25 months, males.
(H) Apoptotic cells in liver were identified by IF with an antibody to cleaved caspase-3. N=6–8, 5 and 22 months, females.
(I) F2 isoprostane levels were measured in liver extracts using gas chromatography and mass spectrometry. N=4–7, 5 and 23–27 months, males.
(J) O2 consumption by young animals over a 24 hour period. Statistical significance in was computed using two-way ANOVA (time, genotype). Genotype factor was significantly different; p<0.001. N=8, 5 months, both sexes.
(K) O2 consumption by old animals. P(genotype) <0.001. N=7–8, 17–22 months, males.
See also Figure S5.

