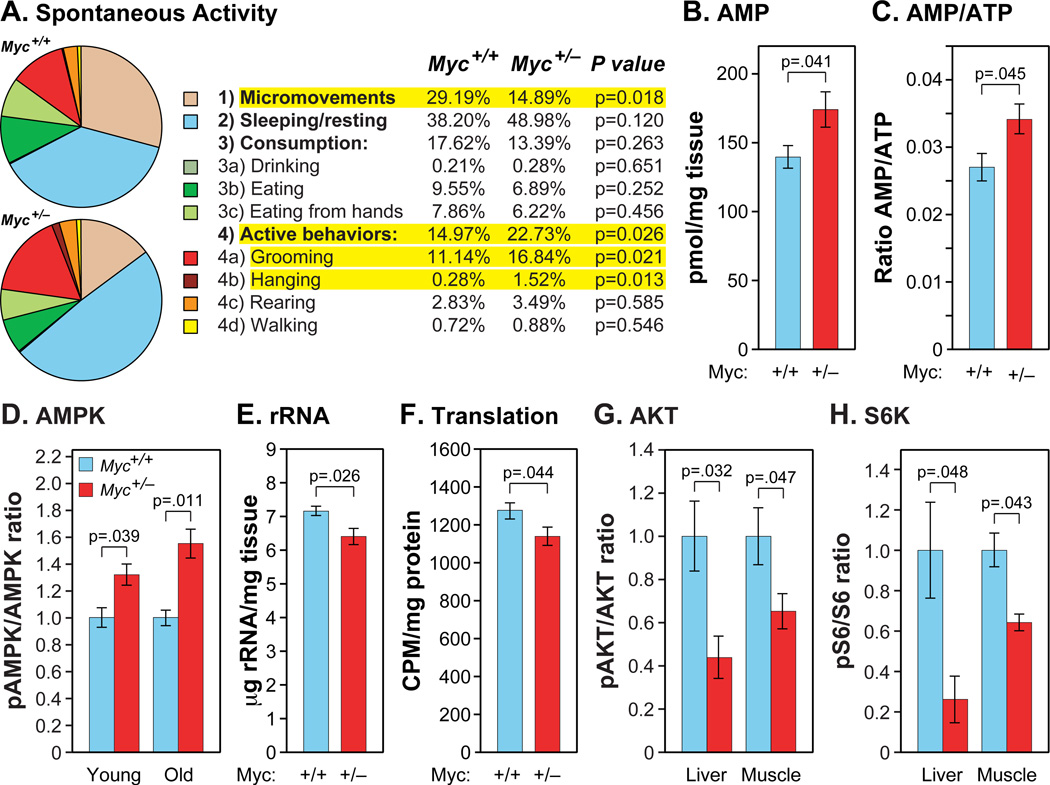
Figure 6. Spontaneous Activity, Energy Metabolism and Signaling Pathways.
(A) Spontaneous home cage activity. Of the 4 categories of behaviors (micromovements, sleeping, consumption, and active behaviors), micromovements and active behaviors were statistically different. N=6, 16–18 months, males.
(B) AMP concentrations in extracts of muscle. N=5–7, 25–30 months, both sexes.
(C) AMP to ATP ratio in the same samples (B).
(D) The ratio of phosphorylated (Thr172) to total AMPKα in muscle was determined by immunoblotting. Data are normalized to Myc+/+ for each comparison. N=4, 9–11 months, females; N=3, 25–30 months, both sexes.
(E) Ribosomal RNA content of liver. N=4, 23–25 months, female.
(F) Translation rates in live animals (liver) were assessed using 3H-phenylalanine incorporation into total protein. Muscle showed the same trend. N=5, 5–7 months; males.
(G) The ratio of phosphorylated (Ser473) to total AKT in liver and muscle. N=4, 9–11 months, female (same samples as in D). Normalized to Myc+/+.
(H) The ratio of phosphorylated (Ser235/236) to total S6 ribosomal protein in liver and muscle (same samples as in G. Normalized to Myc+/+.
See also Figure S6.

