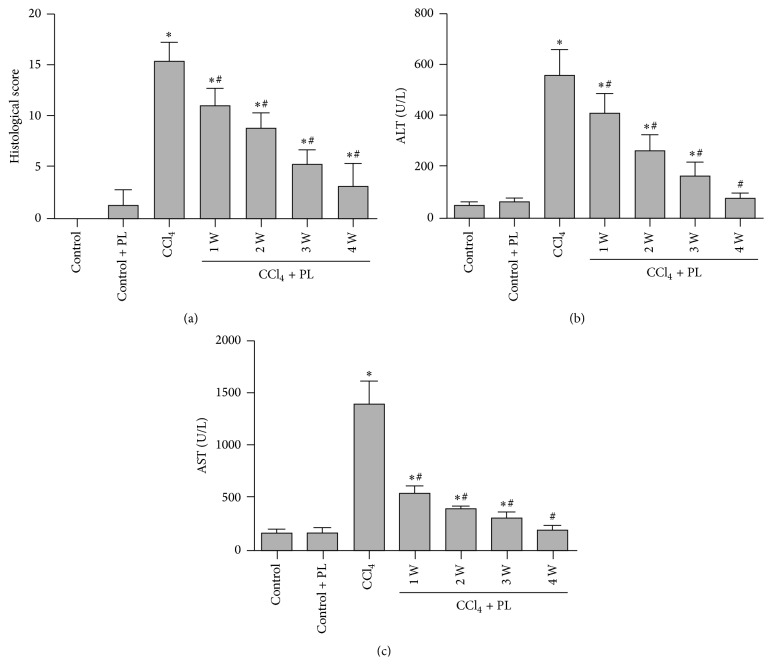
Figure 2.
Effect of PL on liver fibrosis and liver enzymes in rats from different groups. (a) represents liver fibrosis score from Masson's trichrome staining according to the Semiquantitative Scoring System. (b) and (c) show the levels of ALT and AST from different groups, respectively. ∗ indicates P < 0.05 compared to control group while # indicates P < 0.05 compared to CCl4 group.

