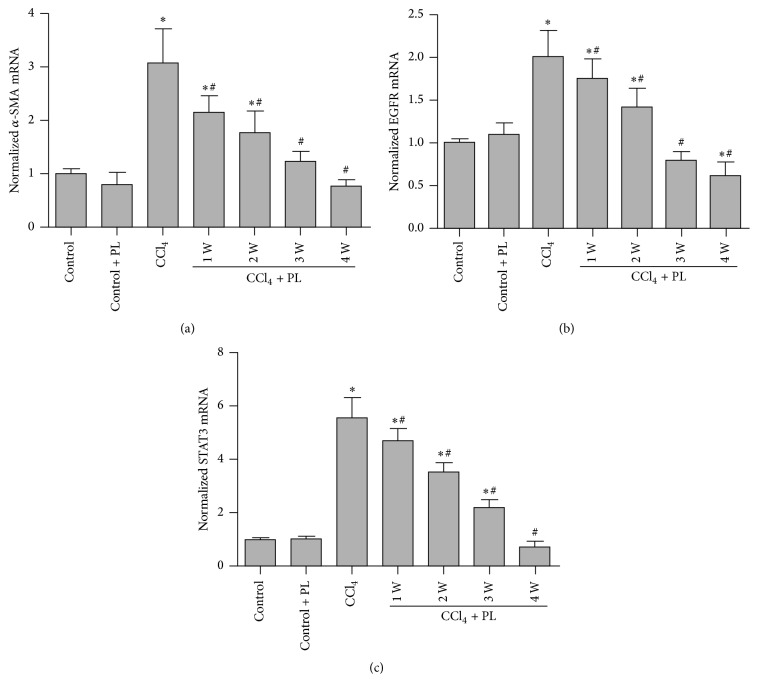
Figure 4.
Plumbagin regulation of mRNA levels of α-SMA, EGFR, and STAT3 in the liver from different groups. (a) shows the mRNA level of α-SMA; (b) represents the mRNA level of EGFR; and (c) shows the mRNA level of STAT3 in the liver. Data represent the mean ± SD of 6 mice and relative expression was normalized to the level of beta-actin. ∗ indicates P < 0.05 compared to control group while # indicates P < 0.05 compared to CCl4 group.

