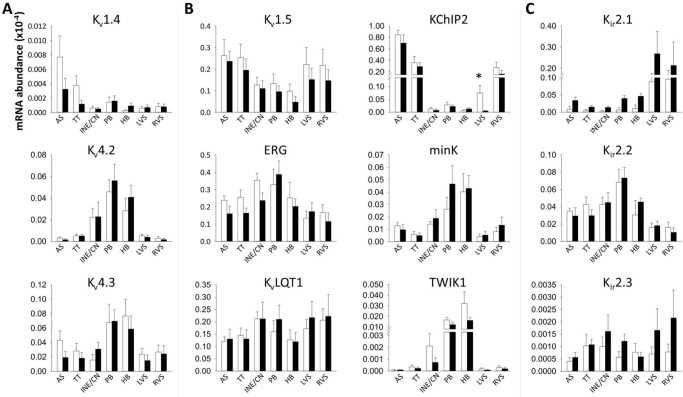
Fig 6. Relative abundance of mRNA for I to, I K,ur, I K,r, I K,s, I K1 and TWIK1 α- and β-subunits as measured by RT-PCR.
Abundance is relative to that of 28s RNA. Means±SEM, n = 9; *P<0.05 for control animals versus heart failure animals by Limma test. AS, atrial septum; HB, His bundle; INE/CN, inferior nodal extension and compact node; LVS, left ventricular septum; PB, penetrating bundle; RVS, right ventricular septum; TT, transitional tissue; White bars, control animals; black bars, heart failure animals.

