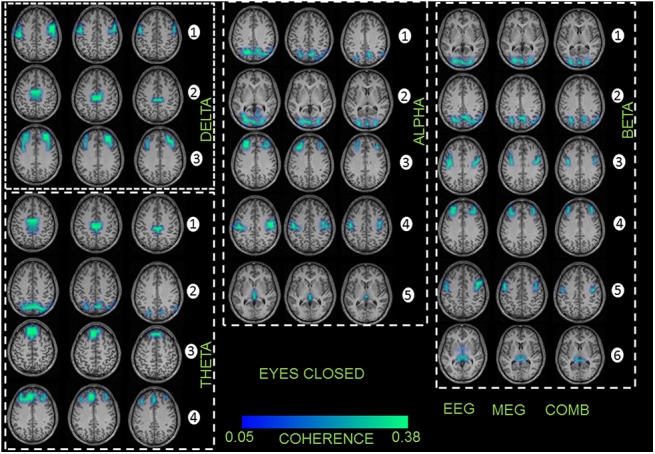
Fig 3. First column represents the recording method EEG in each frequency band showing the grand average statistical map of network of sources for the eyes closed (EC) condition.

Second column represents the recording method MEG for each frequency band separately. Third column represents the combined approach (EEG+MEG). The numbers indicate the order of sources found for each frequency band separately.
