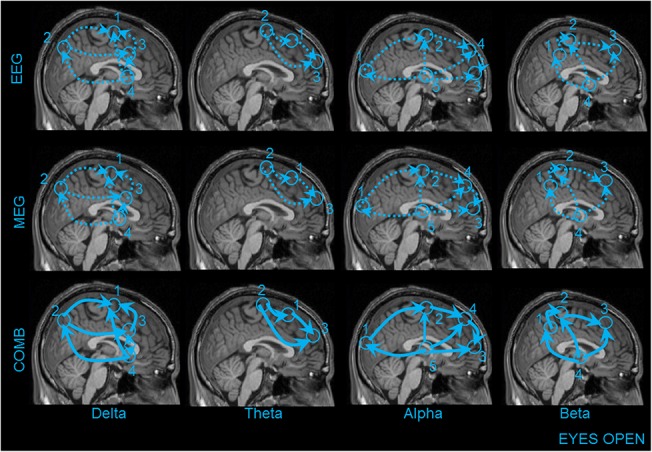
Fig 6. This figure illustrates the information flow between the coherent sources in the brain for the EC condition using EEG (first row), MEG (second row) and COMB (EEG+MEG) (Third row).

The numbering of the sources are the same as in the previous Figs 3 and 4. The dotted lines indicate weaker interactions found between the sources for the recording methods EEG and MEG separately. The bold line with the arrow heads indicates significant higher directional interaction between the sources for only the combined approach (EEG+MEG).
