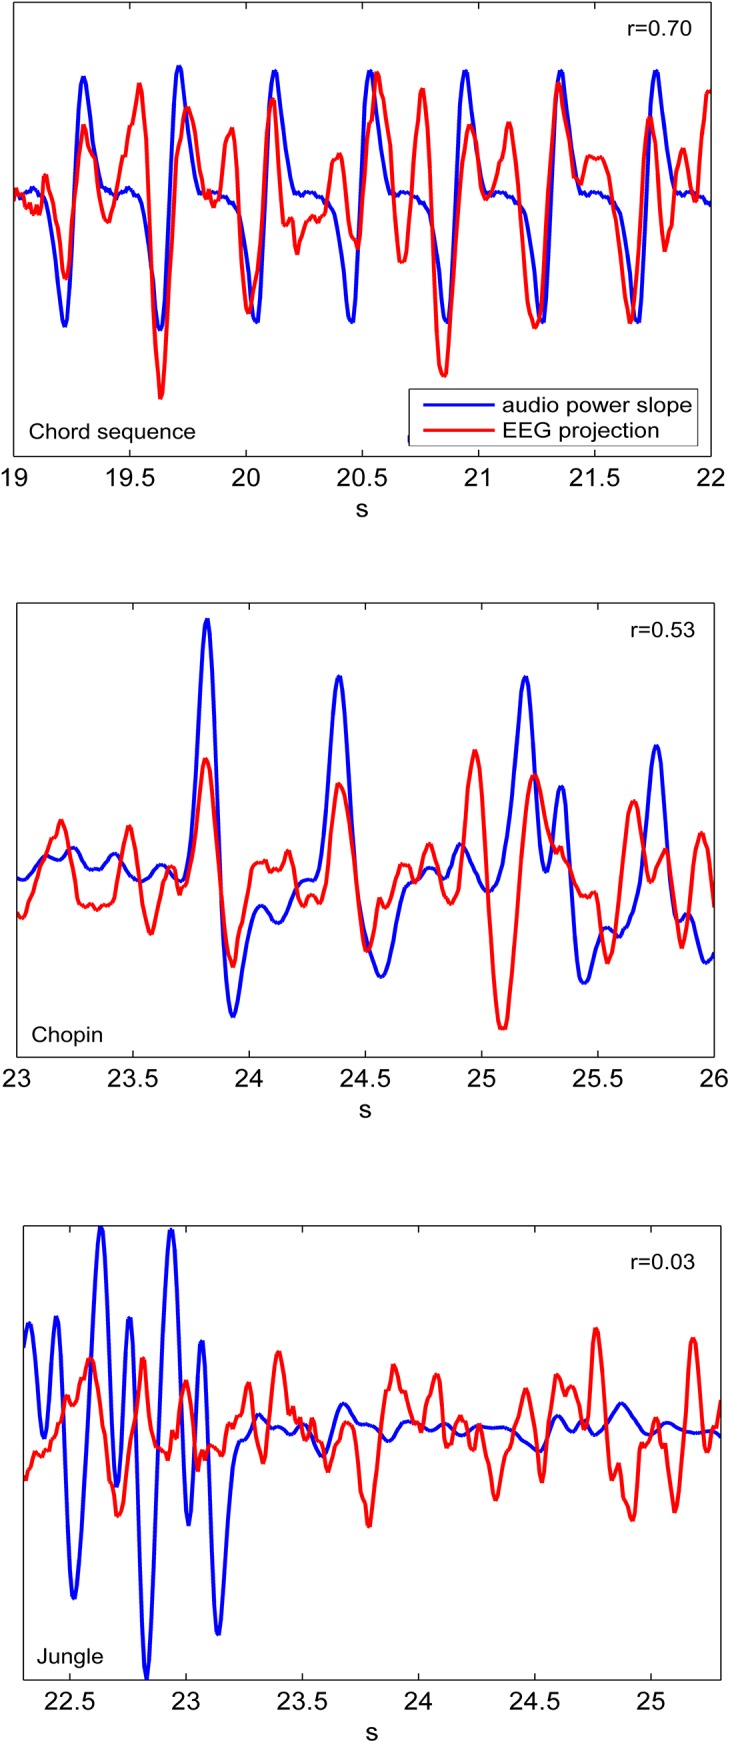
Fig 5. EEG projections.

Three examples that show 3s-long segments of an extracted EEG projection (red) for a single stimulus presentation and a single subject and the respective audio power slope (blue) of Chords, Chopin Etude and Jungle noises. Note that in the optimization procedure a time lag between stimulus and brain response is integrated in the spatio-temporal filter, and that, consequently, the resulting EEG projections shown here are not delayed with respect to the audio power slope. The correlation coefficients indicate the magnitude of correlation for the shown segment of 3 s.
