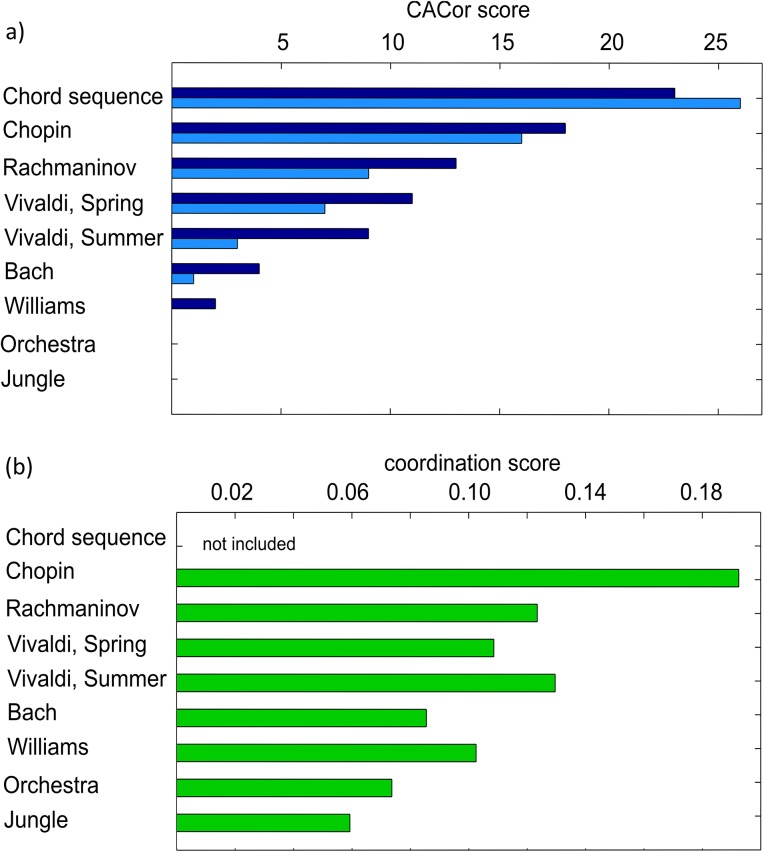
Fig 6. CACor score profile and Coordination score profile.
The CACor score profile for the set of nine stimuli summarizes in how many of the 27 presentations significant Cortico-Acoustic Correlation was detected. Significance of correlation was determined (1) in a permutation-testing approach (darkblue bars) and (2) with Pyper et al.’s method (light blue bars) to estimate the effective degrees of freedom (see Methods). b) Behavioral Coordination score profile. All profiles are sorted according to the descending CACor score.

