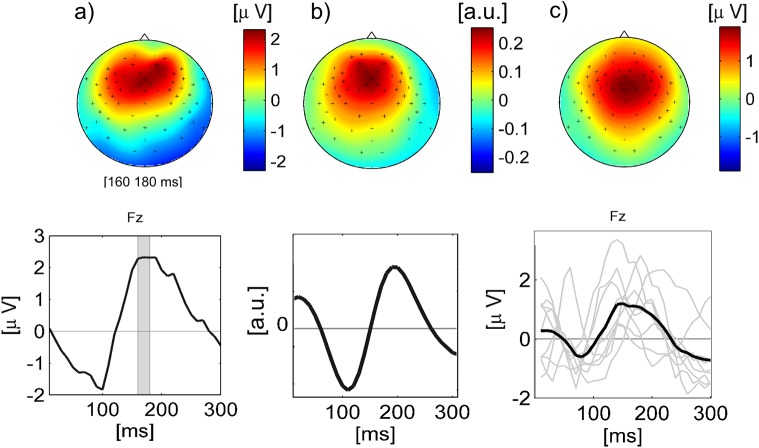
Fig 7. ERPs and MUSIC components.
(a): Scalp topography (top) and time course (bottom) of ERP (single subject) derived by averaging channel Fz for all tone onsets of the stimulus 'Chord sequence'. The scalp topography corresponds to the shaded interval of 160–180 ms in the time course. (b): Spatial (top) and temporal (bottom) dimension of MUSIC component derived from spatio-temporal patterns for the same subject. c) Top: Reference pattern for selection of consistently occurring MUSIC components. This pattern is the Grand Average scalp topography obtained with classical ERP analysis. Individual scalp patterns that are contained in the Grand Average were determined by taking the mean scalp pattern across a 20 ms window that corresponds to the maximum amplitude of each subject’s onset ERP at channel Fz. The time windows of maximum amplitude were determined by visual inspection and ranged between 130 and 250 ms after tone onset. The bottom part of c) shows the individual time courses (grey) as well as the average time course (black).

