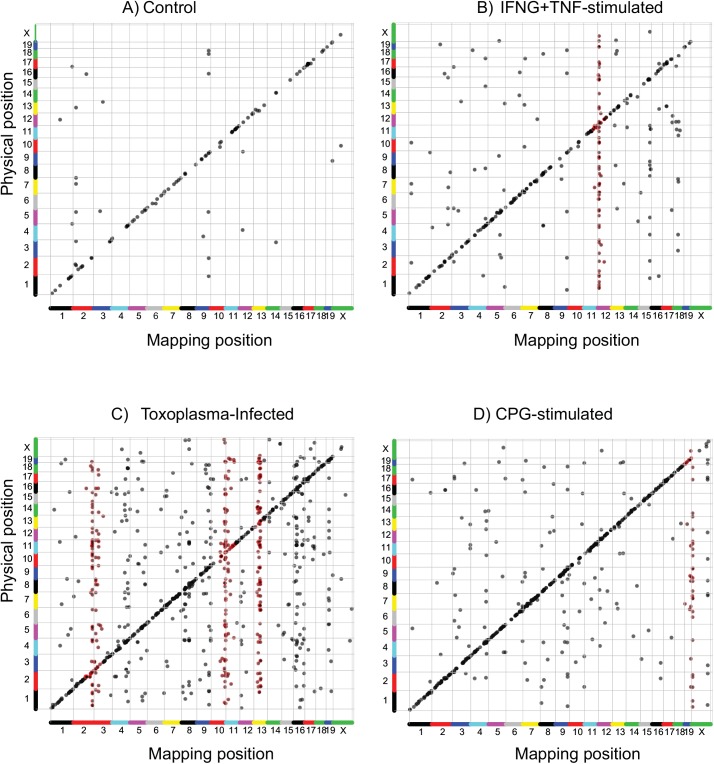
Fig 2. The transcriptional response in BMDM is regulated by stimulation-specific trans-loci.
Expression quantitative trait loci (eQTL) in the RI mice were mapped in A) non-stimulated, B) IFNG+TNF-stimulated, C) Toxoplasma-infected, and D) CpG-Stimulated BMDM. Each dot represents a single eQTL (transcript). Significant eQTL located ≤ 10 Mb from the start of the physical location of the corresponding gene were designated as cis mapping (diagonal lines). All other eQTL were designated as trans-mapping (vertical lines). eQTL significance was calculated after 1000 permutations and reported at genome-wide thresholds corresponding to FDR ≤ 10%. Red spots identify genes mapping to a trans-eQTL hotpot (trans-band).

