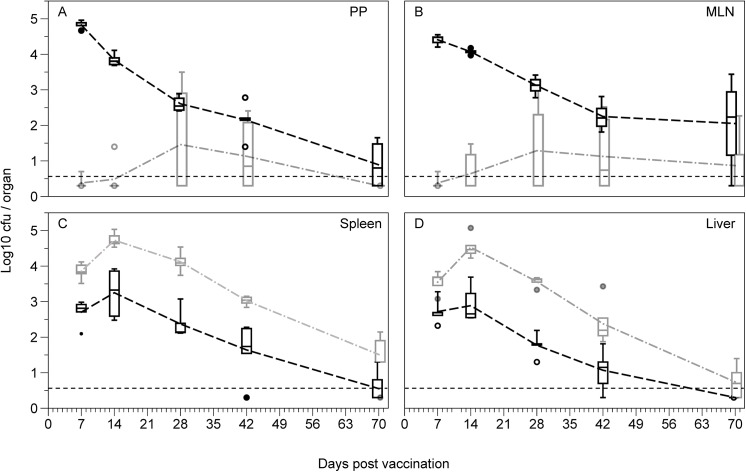
Fig 1. Growth and clearance of the vaccine strain BRD509 following vaccination.
Bacterial loads in the (A) Peyer’s patches (PP), (B) mesenteric lymph nodes (MLN), (C) spleen and (D) liver of mice over 10 weeks following either oral vaccination with 1010 cfu S. Typhimurium BRD509 (black), or intravenous vaccination with 102 cfu S. Typhimurium BRD509 (grey) (n = 4–7 per group). Dashed grey and black lines represent the means for the IV and oral groups respectively. Boxplots display medians, IQRs and the complete spread of data. Dotted black lines represent the minimum detection limit of the assay (5 cfu). IV vaccination resulted in much higher levels of colonisation in the spleen and liver than oral vaccination, though was rarely detected in the Peyer’s patches or mesenteric lymph nodes.

