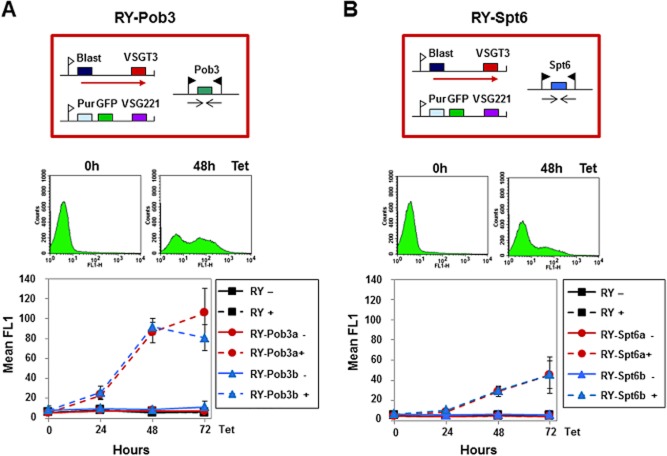
Figure 2.
Derepression of silent VSG ESs after knockdown of the FACT small subunit Pob3.A. Significant ES derepression after depletion of Pob3. The schematic shows the T. brucei RY-Pob3 RNAi cell line with a blasticidin (Blast) resistance gene in the active VSGT3 ES and a puromycin (Pur) resistance and GFP gene in the silent VSG221 ES. The ES promoters are shown as white flags with transcription indicated with a red arrow. The Pob3-RNAi fragment is transcribed from two opposing T7-promoters (black flags). Below, flow cytometry traces show analysis of RY-Pob3 cells before or after the induction of Pob3-RNAi with tetracycline (Tet) for the time indicated in hours (h). Derepression of the silent VSG221 ES promoter is monitored as an increase in green fluorescence in the FL1 channel (x-axis). The graph shows the mean fluorescence in the FL1 channel through time after induction of Pob3-RNAi in the RY-Pob3a and RY-Pob3b cell lines compared with the parental RY line. The mean of three independent experiments is plotted with the standard deviation indicated with error bars.B. There is no significant ES derepression after knockdown of the putative histone chaperone Spt6. Analysis of the T. brucei RY-Spt6a and R-Spt6b cell lines after the induction of Spt6 RNAi with tetracycline. Further this panel is as described in panel A.

