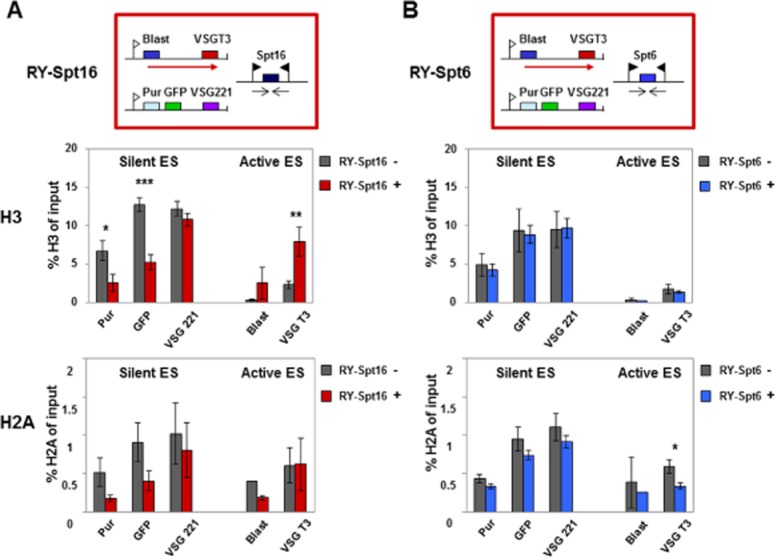
Figure 4.

Knockdown of the FACT large subunit Spt16 results in histone H3 levels decreasing at silent ES promoters and increasing at the active ES.A. Changes in the abundance of histones H3 or H2A at the silent VSG221 ES or active VSGT3 ES in the presence (+) or absence (−) of RNAi against the FACT large subunit Spt16 for 24 h as determined by ChIP. The schematic shows the T. brucei RY-Spt16 cell line with the blasticidin (Blast) resistance gene inserted behind the promoter of the active VSGT3 ES, and the puromycin (Pur) resistance and GFP genes integrated at the silent VSG221 ES promoter as indicated in Fig. 2. The upper bar graph shows the abundance of histone H3 at the silent VSG221 ES compared with the active VSGT3 ES. In the lower bar graph comparable experiments show the abundance of histone H2A after knockdown of Spt16 with RNAi. Statistical significance of the results was determined with significant: * (P = 0.01–0.05); very significant: ** (P = 0.001–0.01) and extremely significant: *** (P < 0.001) indicated.B. Knockdown of the putative histone chaperone Spt6 does not lead to extensive changes in levels of histones H3 or H2A at ESs. This panel is as described in panel A, only Spt6 was analysed instead of Spt16.
