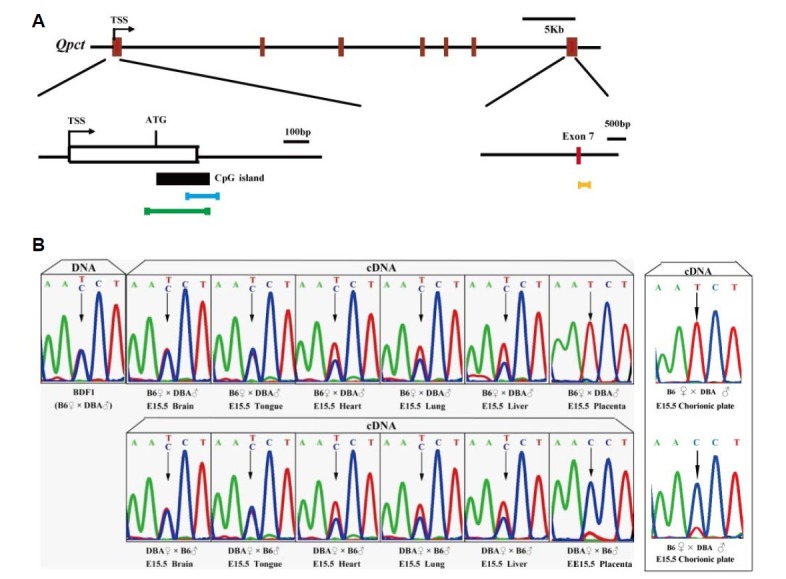
Fig. 1.

Genomic structure diagram and imprinting analysis of Qpct gene in mouse embryo and placenta. (A) Brown-red, exon; black vertical line, intron; blue horizontal line, position of methylation analysis primers; green horizontal line, position of ChIP analysis primers; yellow horizontal line, position of imprinting analysis primers; TSS, transcriptional start site. (B) Sequencing of genomic DNA from E15.5 C57BL/6 and DBA embryos, placenta and chorionic plate from hybrid F1 is heterozygous for polymorphism C/T. Sequencing of cDNA from hybrid F1 proves maternally biased expression of Qpct in E15.5 placenta and chorionic plate.
