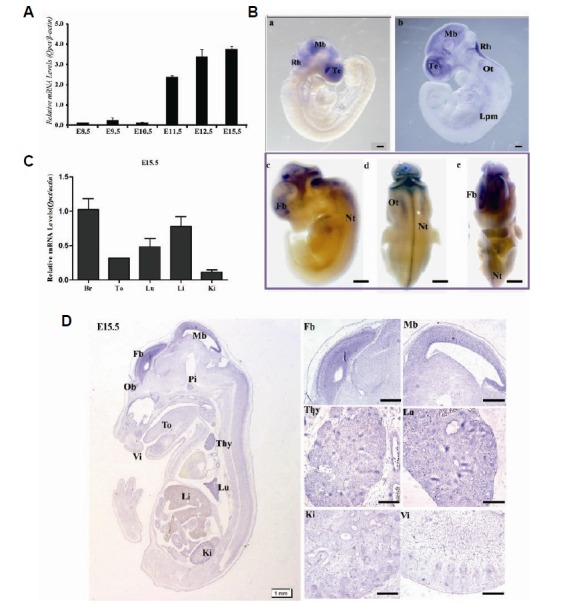
Fig. 2.

Spatiotemporal expression pattern of Qpct during mouse embryogenesis. (A, B) Expression of Qpct in E9.5, E10.5, and E11.5 embryos by whole-mount in-situ hybridization and qRT-PCR. Scale bars, 100 μm (B, a–b); 200 μm (B, c–e). Fb, forebrain; Lpm, lateral plate mesoderm; Mb, midbrain; Te, telencephalon. (C) Qpct mRNA expression level in major E15.5 tissues determined by qRT-PCR; qRT-PCR data were normalized to the level of β-actin. (D) Sagittal sections demonstrating widespread expression of Qpct in E15.5 developmental tissues by in-situ hybridization. Scale bar, 50 μm. Thy, thymus; Pi, pituitary; Lu, lung; Li, liver; Ki, kidney; Ob, olfactory bulb; Vi, vibrissae follicle, To, tongue.
