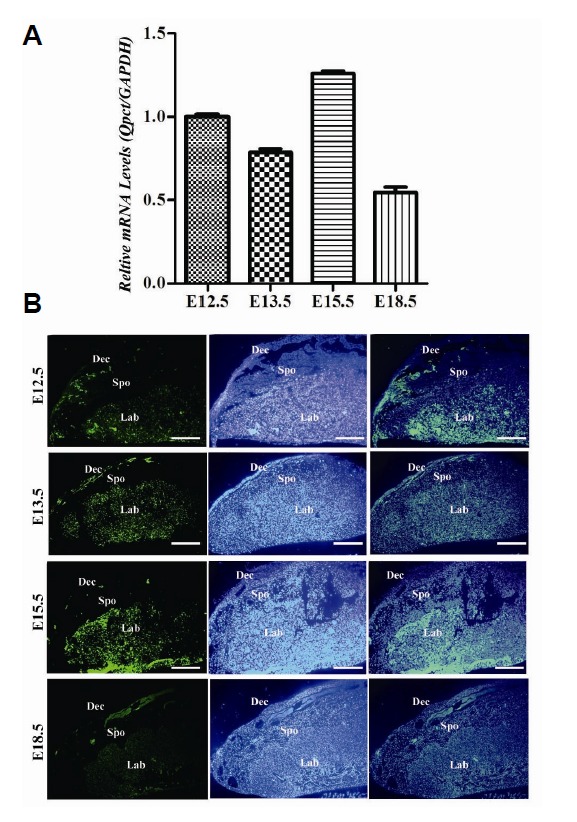
Fig. 3.

Qpct expression in the placenta. (A) Qpct mRNA expression level during early developmental stages of the placenta; qRT-PCR data were normalized to the level of GAPDH. (B) Sagittal sections of E12.5, E13.5 and E18.5, demonstrating by immunocytochemistry that the greatest expression is in the decidual layer and labyrinth. In E15.5 placenta, Qpct was strong expressed in labyrinth layer. Scale bar = 50 μm
