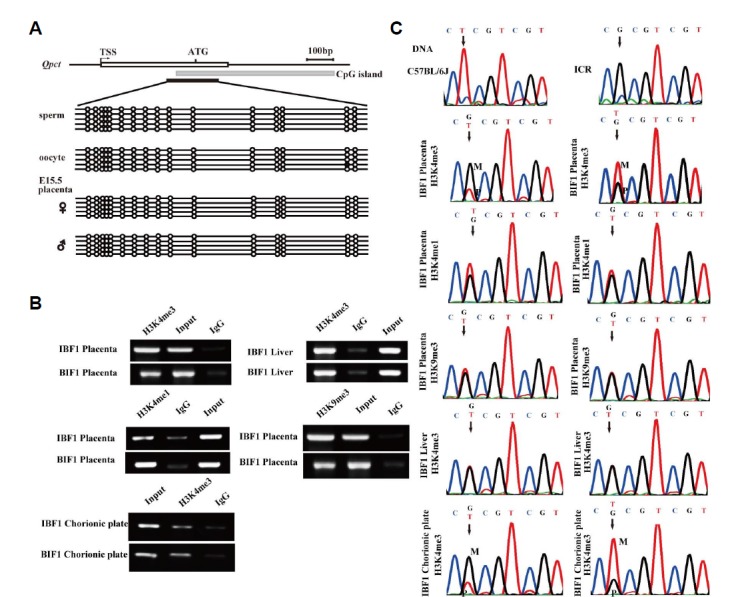
Fig. 4.

Analysis of the imprinting regulatory mechanism of Qpct. (A) Methylation analysis of Qpct in mouse sperm, oocyte, and E15.5 placenta. The methylation primers include 16 CG loci in the CpG island. (B) ChIP assays were performed in placenta and liver (E15.5 BIF1 and IBF1). The immunoprecipated DNA was analyzed by ChIP PCR primers. (C) H3K4me3, H3K4me1 and H3K9me3 histone modification analysis between C57BL/6 and ICR mouse placentae and chorionic plates. G/T (SNP) denotes the M/P peak height by dividing the percentages precipitation of the maternal and paternal alleles (‘M’ and ‘P’ indicate maternal and paternal alleles, as recognized by the SNP); BIF1 (C57BL/6 × ICR); IBF1 (ICR × C57BL/6).
